
Figure EV2. HSET levels control the timing of spindle bipolarization.
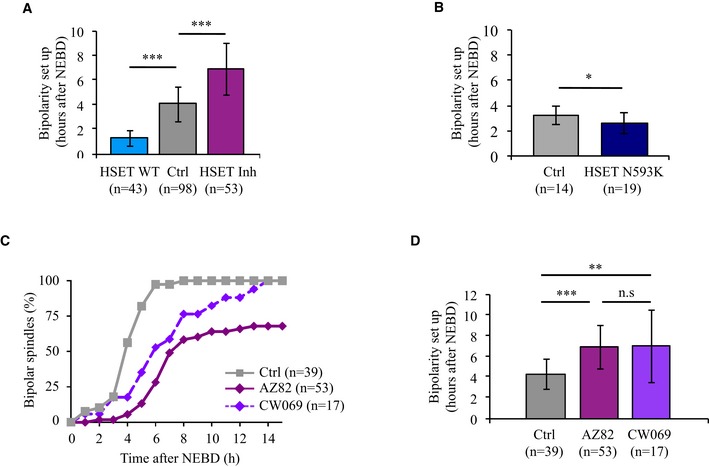
- Histogram showing the mean time of bipolarization setup (data are represented as mean ± SD). Bipolarity was scored when two poles were distinguishable. The mean time of bipolarization setup for oocytes overexpressing HSET WT is 1 h and 19 min (blue bar), compared to 4 h and 3 min for controls (gray bar), ***P‐value < 0.0001, compared to 6 h and 55 min for oocytes inhibited for HSET (purple bar), ***P‐value < 0.0001. Statistical significance of differences is assessed with a Mann–Whitney test.
- Histogram showing the mean time of bipolarization setup in controls vs. HSET N593K expressing oocytes (data are represented as mean ± SD). Bipolarity was scored when two poles were distinguishable. The mean time of bipolarization setup for oocytes overexpressing HSET N593K is 2 h and 36 min (dark blue bar), compared to 3 h and 10 min for the controls (gray bar). Statistical significance of differences is assessed with a t‐test: *P‐value = 0.034.
- Graph representing the kinetics of spindle bipolarization in controls (gray) vs. oocytes inhibited for HSET with AZ82 (purple) or CW069 (violet). The number of oocytes analyzed is written in parentheses.
- Histogram showing the mean time of bipolarization setup. Bipolarity was scored when two poles were distinguishable. Data are represented as mean ± SD. The mean time of bipolarization setup for controls (gray bar) is 4 h and 18 min, compared to 6 h and 55 min for oocytes inhibited for HSET with AZ82 (purple bar), compared to 7 h and 0 min for oocytes inhibited for HSET with CW069 (violet bar). Statistical significance of differences is assessed with a Mann–Whitney test: **P‐value = 0.007, ***P‐value < 0.0001, not significant (n.s.) P‐value = 0.929. The number of oocytes analyzed is written in parentheses.