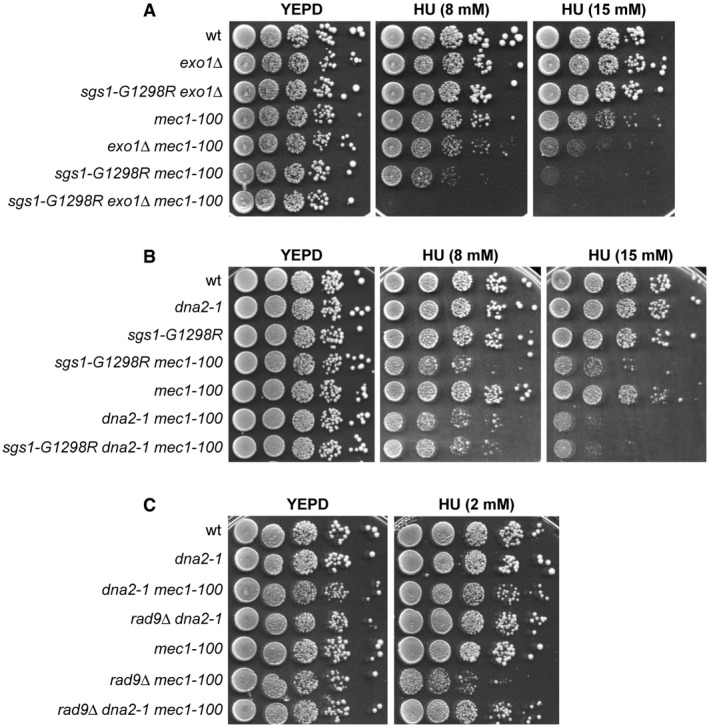
Figure 4. Epistatic relationships between rad9∆, sgs1‐G1298R, exo1∆, and dna2‐1 with respect to the HU sensitivity of mec1‐100 cells.

-
A–CExponentially growing cell cultures were serially diluted (1:10), and each dilution was spotted out onto YEPD plates with or without HU at the indicated concentrations.
