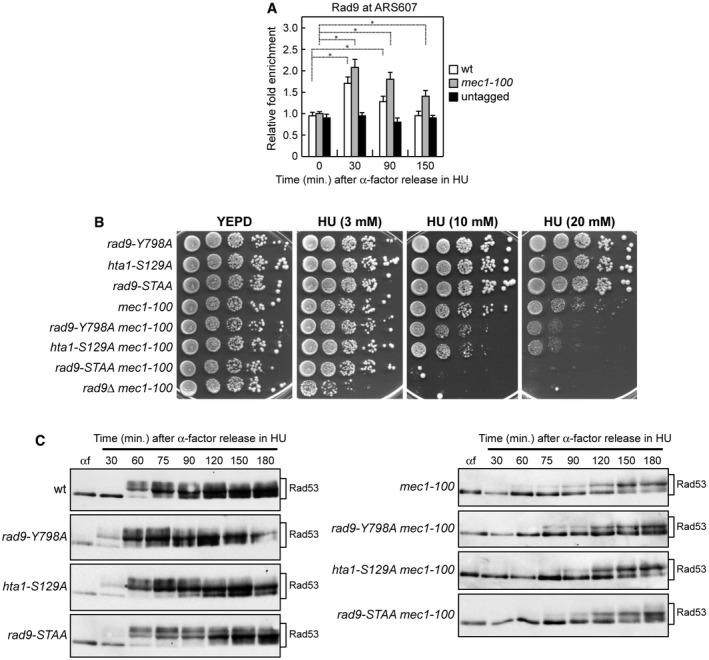
Figure 5. The lack of Rad9‐Dbp11 interaction exacerbates HU sensitivity of mec1‐100 cells.

- ChIP analysis. Cells were arrested in G1 with α‐factor and then released in YEPD containing 0.2 M HU at time zero. Relative fold enrichment of Flag‐tagged Rad9 at ARS607 replication origin was determined after ChIP with anti‐Flag antibodies and subsequent qPCR analysis. Plotted values are the mean values with error bars denoting s.d. (n = 3). *P < 0.05 (Student's t‐test).
- Exponentially growing cell cultures were serially diluted (1:10), and each dilution was spotted out onto YEPD plates with or without HU at the indicated concentrations. The hta1‐S129A strains also carry HTA2 deletion.
- Cells were arrested in G1 with α‐factor (αf) and then released in YEPD containing 0.2 M HU at time zero, followed by Western blot analysis of protein extracts with anti‐Rad53 antibodies.
Source data are available online for this figure.
