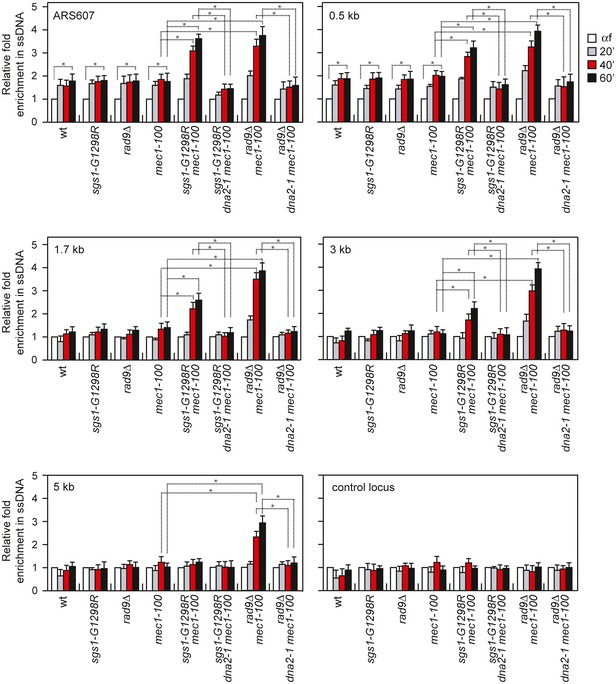
Figure 7. ssDNA generation at stalled forks in mec1‐100 cells is increased by either Sgs1‐G1298R or the lack of Rad9 in a Dna2‐dependent manner.

Analysis of ssDNA formation at different distances from ARS607 by qPCR. Exponentially growing YEPD cell cultures were arrested in G1 with α‐factor (αf) and then released in YEPD containing 0.2 M HU. Genomic DNA prepared at different time points after α‐factor release was either digested or mock‐digested with SspI and used as template in qPCR. The value of SspI‐digested over non‐digested DNAs was determined for each time points after normalization to an amplicon on chromosome XI that does not contain SspI sites. The data shown are expressed as fold enrichments in ssDNA at different time points after α‐factor release in HU relative to the α‐factor (αf) (set to 1.0). A locus containing SspI sites on chromosome XI is used as a control (control locus). The mean values are represented with error bars denoting s.d. (n = 3). *P < 0.05 (Student's t‐test).
