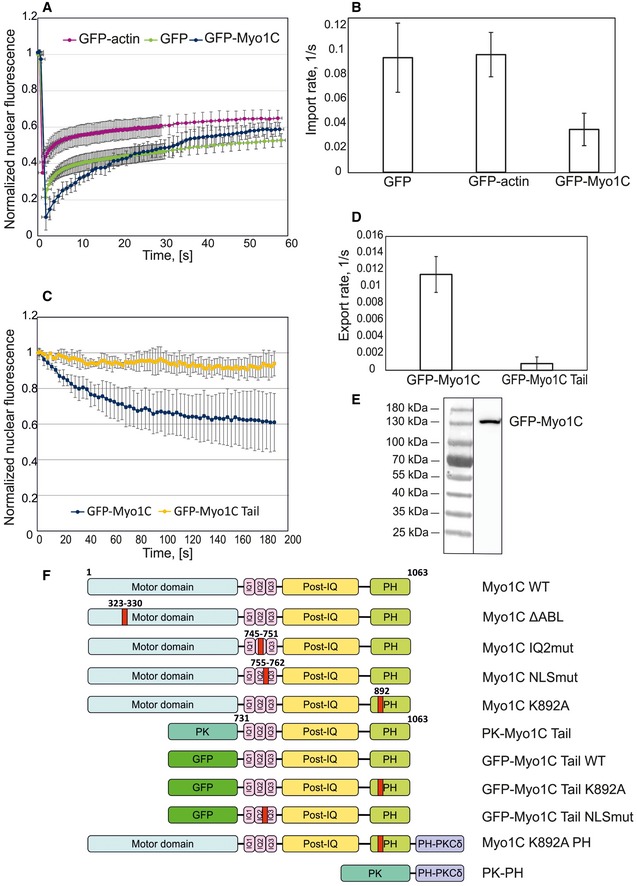
Figure 1. Myo1C constantly shuttles between the nucleus and cytoplasm.

- Fluorescence recovery after photobleaching experiments with GFP‐Myo1C, GFP‐actin, and GFP; data represent nuclear fluorescence levels normalized to the value before bleaching and are the mean ± SD (GFP n = 10; GFP‐actin n = 8; GFP‐Myo1C n = 11).
- Nuclear import rate derived from the FRAP curves; data represent mean rates from individual experiments ± SD (n as in A).
- FLIP experiments with GFP‐Myo1C and GFP‐Myo1C tail WT; data represent normalized nuclear fluorescence levels and are the mean ± SD (n = 8).
- Nuclear export rate quantified from FLIP curves; data represent mean rates from individual experiments ± SD (n = 8).
- Western blot showing that GFP‐Myo1C is expressed as a full‐size protein with no signs of degradation.
- Schematic of Myo1C constructs used in the present study. Pleckstrin homology domain of Myo1C (PH), chicken pyruvate kinase (PK), and pleckstrin homology domain of phospholipase C, isoform δ (PH‐PKCδ), are indicated in the chart. HA‐tag was in the N‐terminus of the constructs. Note that “tail” construct contains also the neck region of Myo1C.
