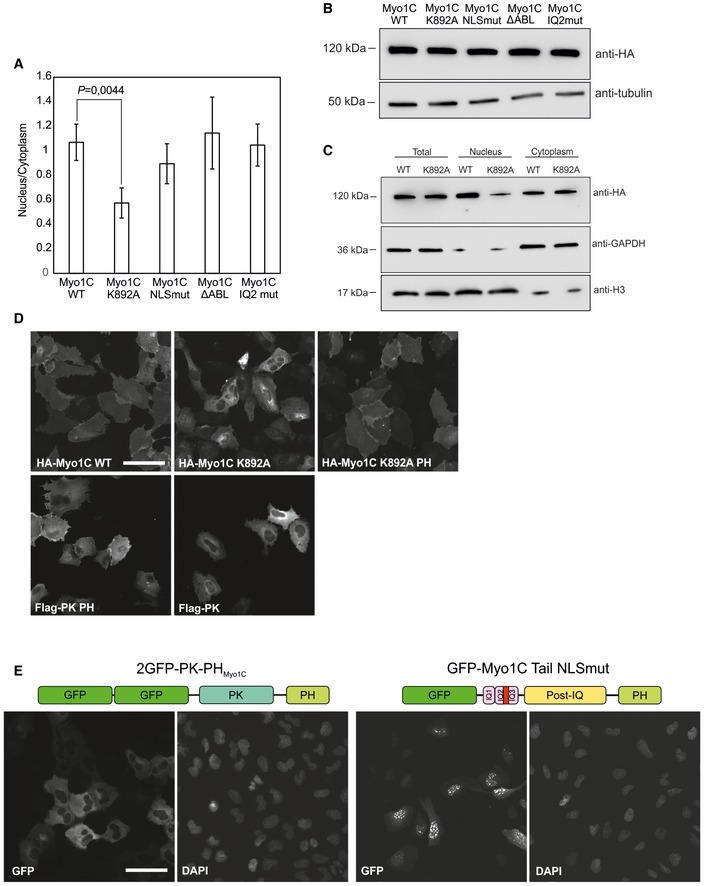
Figure EV1. Cellular localization of Myosin‐1C constructs.

- Quantification of nuclear to cytoplasmic ratios of fluorescence signal in cells transfected with HA‐tagged Myo1C constructs. Human osteosarcoma cells (U2OS) were imaged with confocal microscope and fluorescence intensities of randomly chosen cells (40–50 cells/construct) were calculated using Microscopy image browser software. Data are mean ± SD. Student's t‐test for statistical significance.
- Western blot showing expression levels of HA‐Myo1C constructs in the stable cell lines used in Fig 2A and B.
- Western blot analysis of Myo1C WT and K892 in nuclear and cytoplasmic fractions obtained by cell fractionation in detergent‐free conditions (see Materials and Methods for more details).
- Addition of PH domain to Myo1C K892A rescues its nuclear localization. Figure shows wide‐field fluorescence microscopy images of human osteosarcoma (U2OS) cells transiently transfected with specified HA‐tagged Myo1C constructs; localizations are quantified in Fig 2E. Scale bar, 40 μm.
- Immunofluorescence images showing localization of the PH domain of Myo1C fused with chicken pyruvate kinase and that of Myo1C tail with mutated NLS sequence in human osteosarcoma cells (U2OS). Scale bar, 40 μm.
