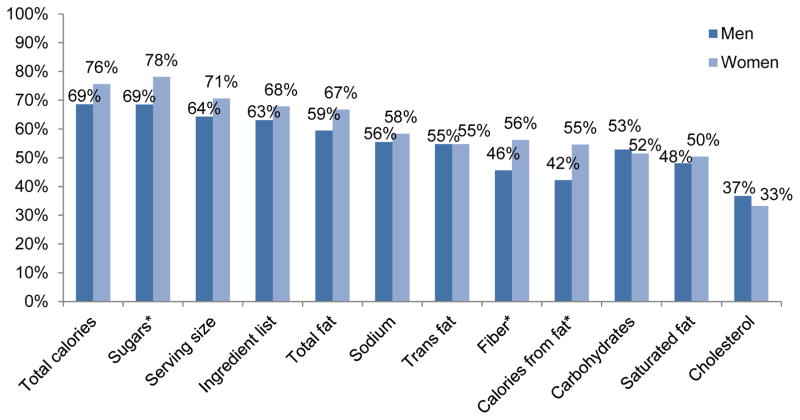
Figure 1.
Percentage of Nutrition Facts users in the Project EAT-IV study (n ranges from 561–566 for each piece of dietary information) who reported using specific types of nutrition information on the label “most of the time” or “always”.
*indicates p<0.05 for the comparison between males and females

