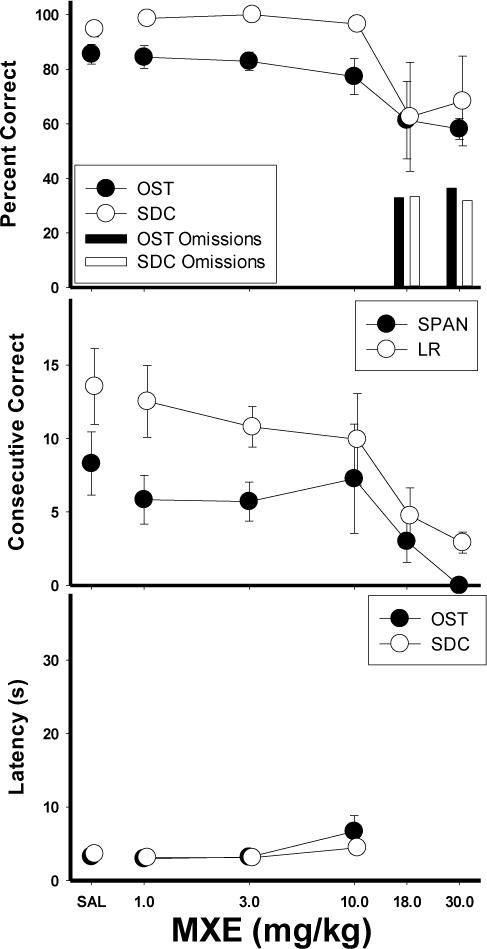
Figure 4.

Means for percent correct, consecutive correct, and latency for the MXE group. Top panel shows the effects of MXE on percent correct (circles) and omissions (bars) for the OST (closed circles, dark bars) and SDC task (open circles, light bars). Middle panel shows span (closed circles) and longest run (open circles). Bottom panel shows latency to first response for OST (closed circles) and SDC task (open circles). Vertical lines indicate SEM.
