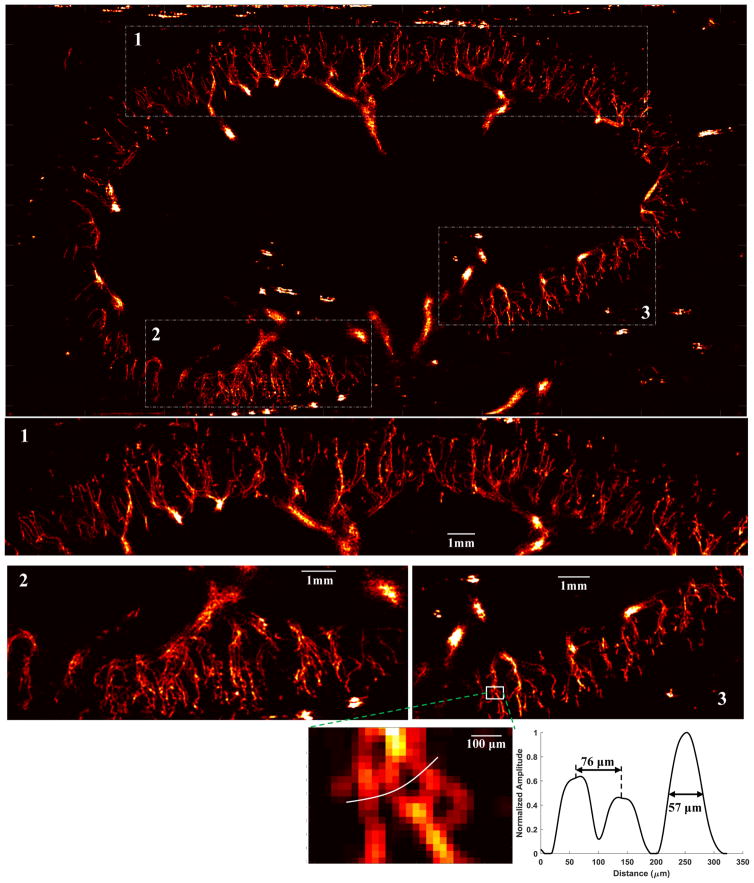
Figure 11.
Super-resolution microvessel perfusion images processed with the local weighted averaging method. Three regions of the original microvessel image were magnified to show the detailed microvasculature. The dynamic microvessel accumulation process can be found in Supplemental video 3. Bottom panel: a branching microvessel at about 2cm depth was located to measure the microvessel cross-section profile.

