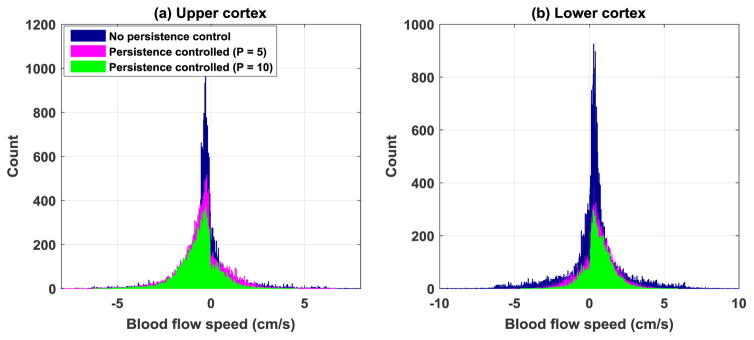
Figure 13.
Histograms showing blood flow speed measurement distributions with different persistence control settings. (a) Upper cortex of the kidney. (b) Lower cortex of the kidney. The same regions of the upper and lower cortex as in Fig. 12 were used to generate the histograms.

