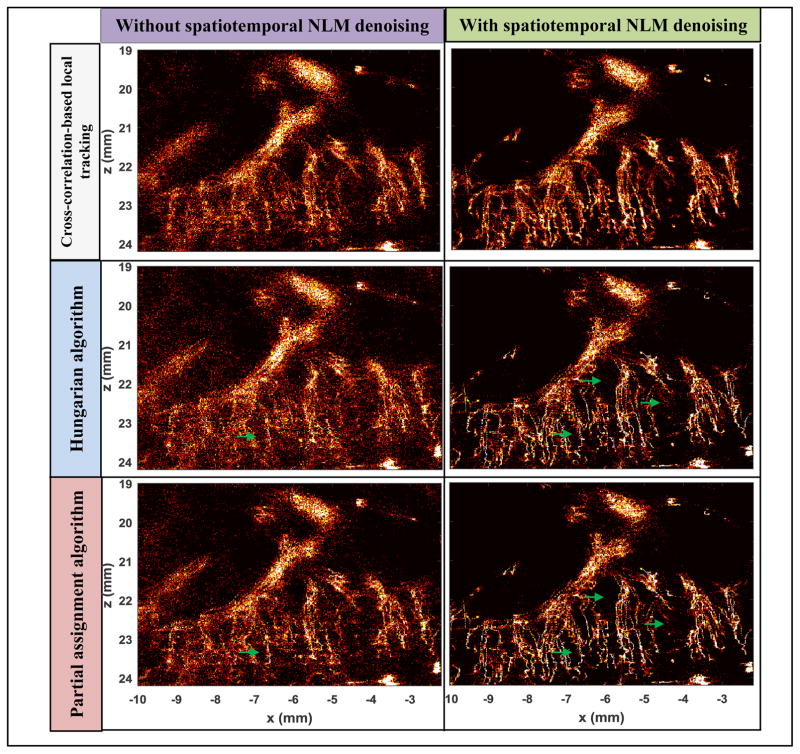
Figure 14.
Microvessel density images processed with various combinations of filtering and tracking methods. Right column images were all denoised with the spatiotemporal NLM filter, and the left column images were not. The corresponding pairing and tracking algorithms are listed on the left side of each row. All density images are displayed under the same scale, which was intentionally set to make the images saturated in order to better illustrate the noise differences among different methods.

