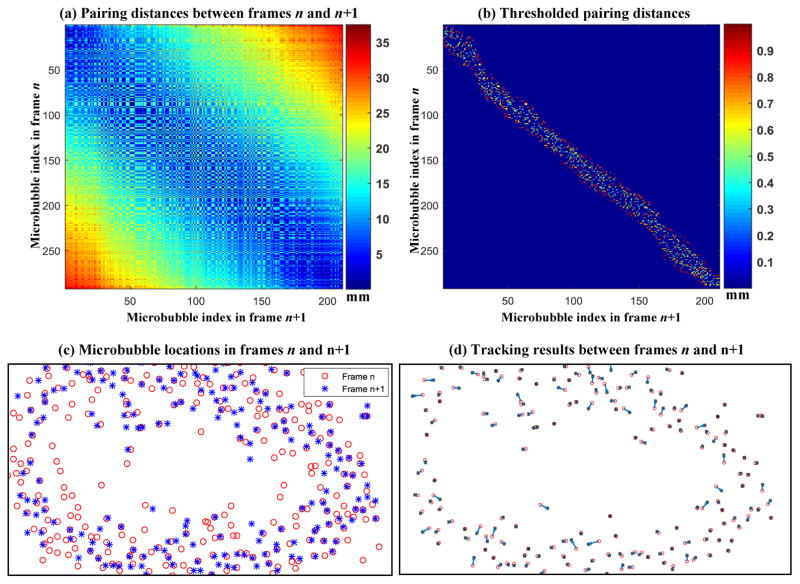
Figure 4.
(a) Distance matrix obtained by calculating the movement distance between all possible pairings of microbubbles from frame n to frame n+1. The axes indicate the indices of the microbubble locations. (b) Thresholded distance matrix using a blood flow speed limit of 50 cm/s. (c) Microbubble locations in frames n and n+1. (d) Bipartite graph tracking result. The blue arrows indicate the distance and direction of microbubble movement between consecutive frames.

