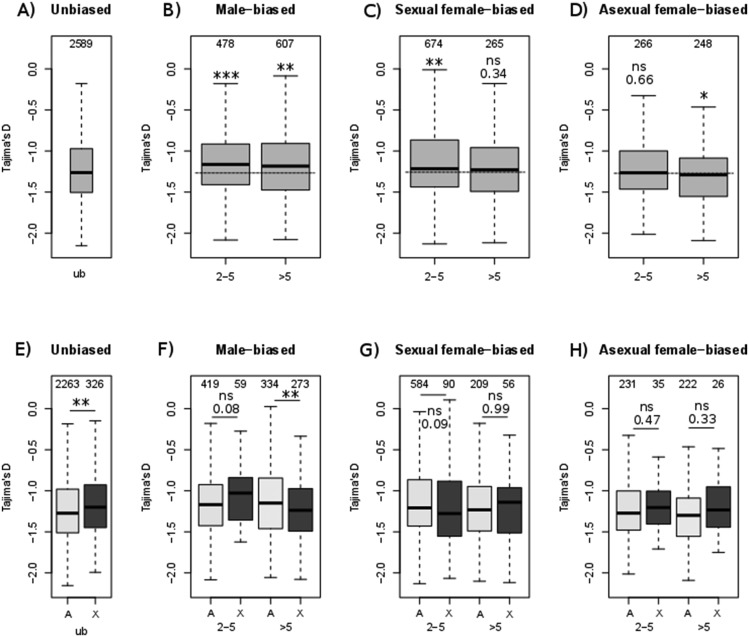
Fig. 4.
—Tajima’s D according to the ratios of gene expression levels between morphs. Panels (A–D) consider all genes together (X-linked and autosomal) and panels (E–H) consider X-linked (dark gray) and autosomal (light gray) genes separately. Terms are defined as in figure 3. Dashed lines show median values for unbiased genes. Significance of differences was tested with Mann–Whitney U tests.

