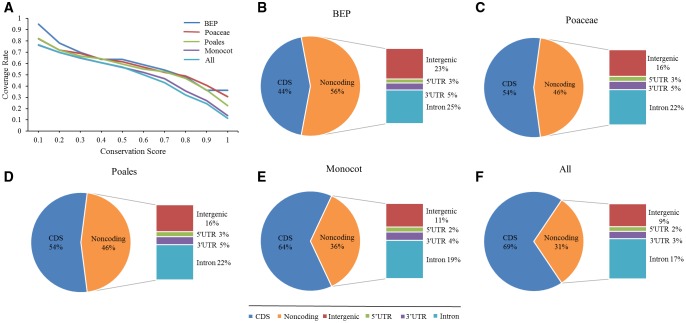
Fig. 3.
—Estimation of the fraction of sites under selection in the rice genome. (A) The fraction of how many species in each clade matched to reference aligned to CDS. Coverage decreased with the increase of the conservation score, but it became stable when the conservation score is close to 0.7. (B–F) Breakdown of sites under selection between coding (CDS) and noncoding regions and among different types of noncoding regions in (B) BEP, (C) Poaceae, (D) Poales, (E) monocots, and (F) all selected genomes.

