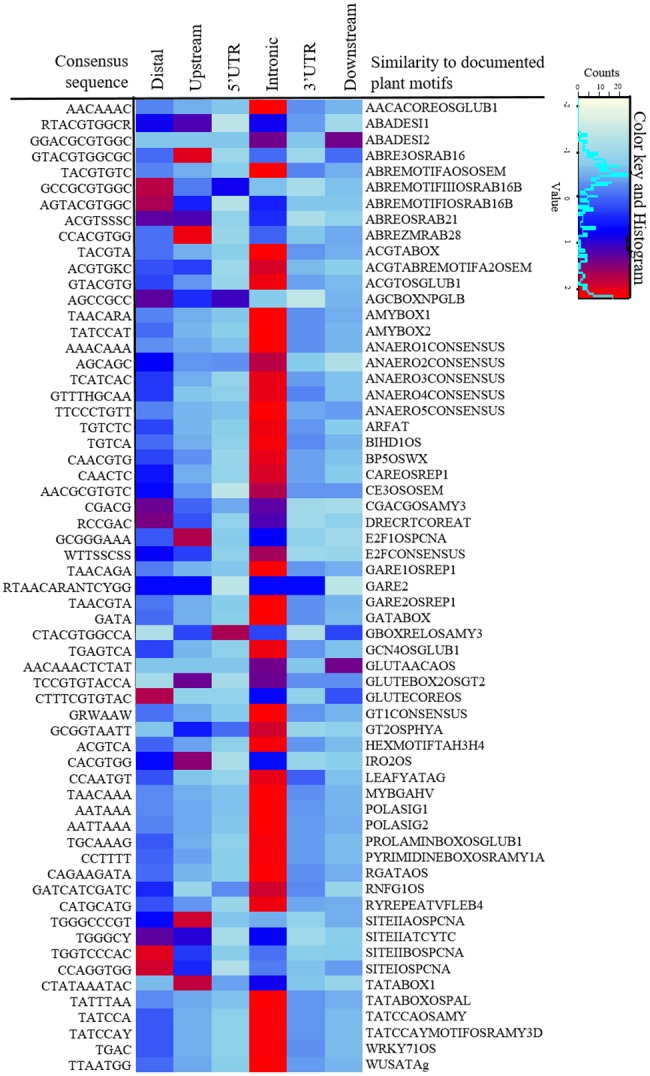
Fig. 7.

—List of sequence motifs that are enriched in the CNSs. Enrichment is defined as z-score >2. Colors in the heat map correspond to different level of fold enrichment. Sequence motif annotations were based on the PLACE database (Higo et al. 1998).
