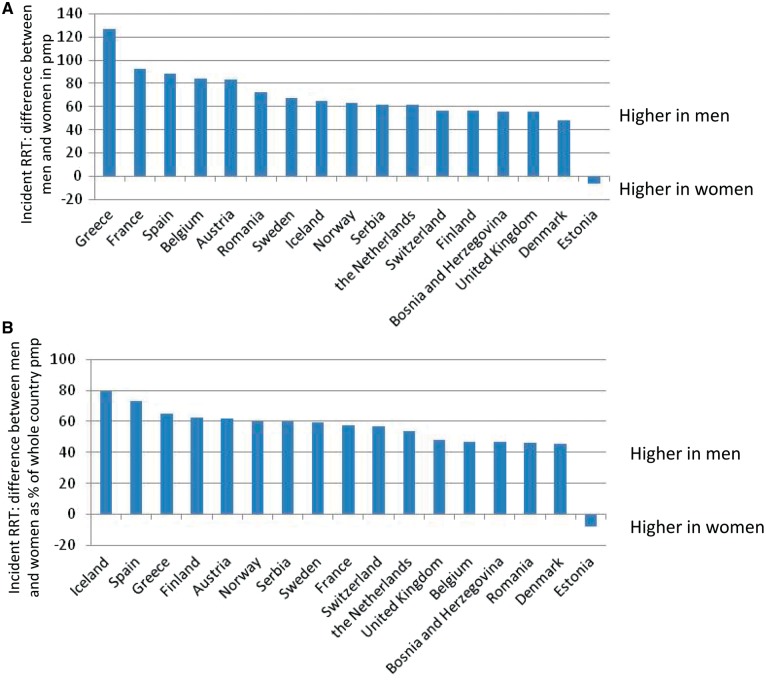
Fig. 2.
Differences between men and women in incident rates of RRT at Day 1, adjusted for age and gender, according to the ERA-EDTA Registry Annual Report 2015 [10]. (A) Difference in the incidence of RRT between men and women expressed in pmp (men pmp − women pmp). (B) Difference in the incidence of RRT between men and women expressed as a percentage of the whole country (men and women) pmp {100 × [(men pmp − women pmp)/(all pmp)]}. Data from countries and regions providing individualized data. For countries not providing whole-country data (Spain, Belgium), the mean value of the different regions was calculated.

