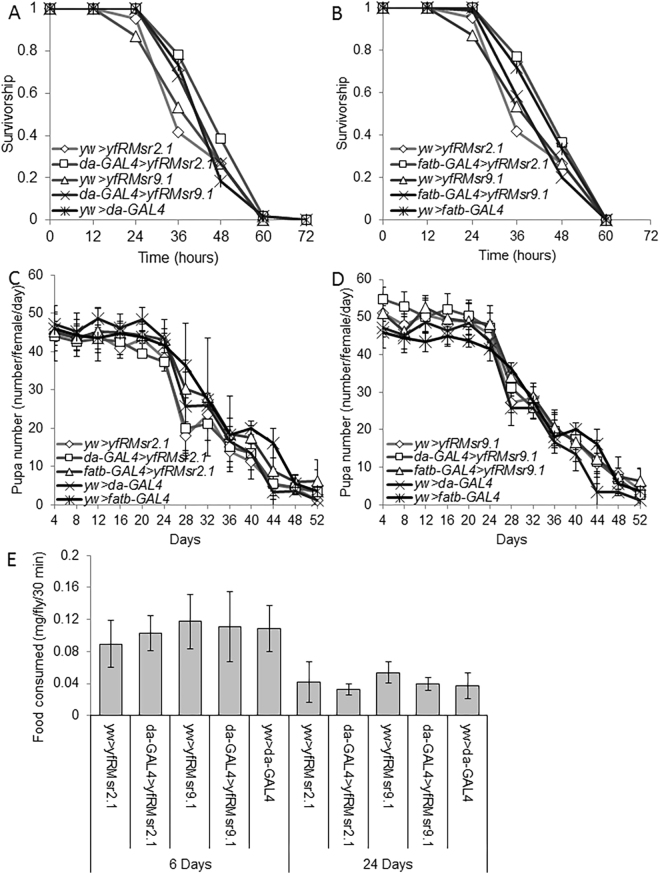
Figure 4.
Starvation resistance, pupa production, and food consumption of fRMsr expressing flies. Survivorship of (A) da-GAL4 > fRMsr2.1, da-GAL4 > fRMsr9.1, da-GAL4 > yw, yw > fRMsr2.1, and yw > fRMsr9.1 strains or (B) fatb-GAL4 > fRMsr2.1, fatb-GAL4 > fRMsr9.1, yw > fatb-GAL4, yw > fRMsr2.1, and yw > fRMsr9.1 strains was examined every 12 h, and the flies were analyzed for resistance to starvation (Log-rank test). Pupa production, expressed as a number per female per day of (C) da-GAL4 > fRMsr2.1, da-GAL4 > fRMsr9.1, da-GAL4 > yw, yw > fRMsr2.1, and yw > fRMsr9.1 strains or (D) fatb-GAL4 > fRMsr2.1, fatb-GAL4 > fRMsr9.1, yw > fatb-GAL4, yw > fRMsr2.1, and yw > fRMsr9.1 strains was analyzed every 4 days until flies were 52-day-old, and the reproduction rate at each time point was examined (Student’s t-test). (E) Flies were reared on the regular corn meal diet and then collected on the 6th or 24th days. Food consumption of da-GAL4 > fRMsr2.1, da-GAL4 > fRMsr9.1, da-GAL4 > yw, yw > fRMsr2.1, and yw > fRMsr9.1 strains for 30 min was measured on the 6th day (mean ± s.d., n = 100~200) and 24th day (mean ± s.d., n = 100~200) via the feeding assay using erioglaucine. Then, food consumption rate was calculated at two different time points (Student’s t-test).

