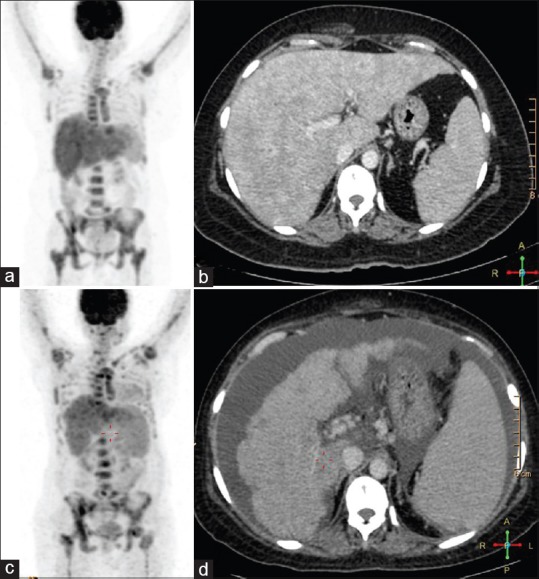
Figure 1.

(a) Whole-body PET image of the patient with extensive liver and skeletal hypermetabolism. (b) Contrast-enhanced computed tomography image done as a part of the positron emission tomography computed tomography demonstrating the multiple enhancing liver metastases. (c) Positron emission tomography done at a later point of time showing shrunken liver with multiple new foci of metabolic activity within the skeleton. (d) contrast-enhanced computed tomography done as part of the positron emission tomography computed tomography done at a later point of time in the course showing significant volume loss of liver with nodular surface and ascites, collateral vessels at the porta, and splenomegaly – all features of hepatic dysfunction and portal hypertension
