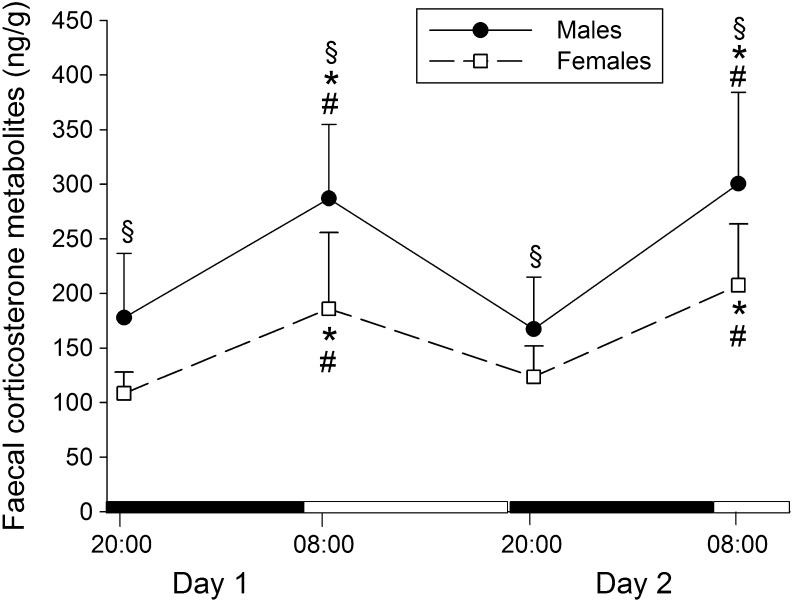
Figure 3.
Mean (±s.d.) faecal corticosterone metabolite levels circadian variation during the dark/light cycle of male (n = 9) and female rats (n = 9). The black areas in the abscissa indicate the dark periods and the white areas the light periods. *P < 0.001 vs day 1 dark phase; # P < 0.001 vs day 2 dark phase; § P = 0.03 vs female rats, ANOVA repeated measures followed by post hoc Bonferroni/Dunn test.

 This work is licensed under a