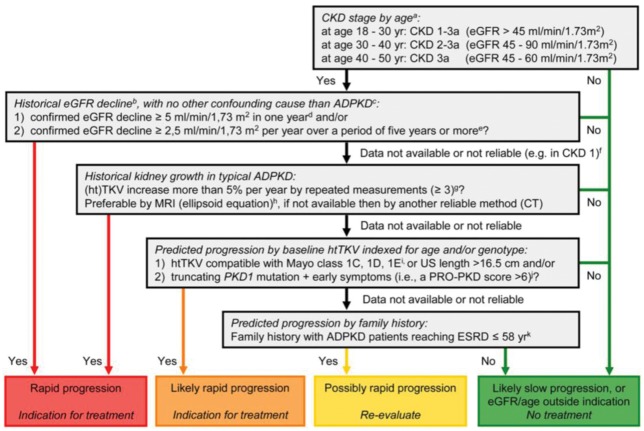
Fig. 1.
Algorithm to assess indications for initiation of treatment in ADPKD. The diagram aims to define rapid progression, and thus allow the identification of patients eligible for treatment. It is based on the assumption that GFR for age, or historical changes in GFR, provides more information on disease progression than changes in TKV or risk prediction scores based on (ht)TKV or PKD gene mutation analysis in conjunction with clinical signs. Patients identified as showing ‘rapid progression’ or ‘likely rapid progression’ may be considered for treatment with tolvaptan. Patients with ‘possible rapid progression’ should be re-evaluated during follow-up visits. Besides assessing the indication for treatment, contraindications to and special warnings for tolvaptan use in ADPKD should be considered. Notes to the decision algorithm: (i) in our opinion, the indication ‘CKD stages 1–3 at initiation of treatment’ is not sufficiently specific as eGFR should be indexed for age. ADPKD patients with a high eGFR for age are unlikely to show rapid disease progression. There is currently no published evidence for the effect of tolvaptan in patients below the age of 18 or above the age of 50 years. (ii) The eGFR may vary over time in individual patients, especially when close to the normal range. To confidently define ‘rapid disease progression’, the rate of eGFR decline should be supported by multiple measurements that reliably indicate a rate of decline in eGFR. For this reason, this criterion should also be defined more strictly when historical data are available for only a short period compared with when available for a longer period. (iii) When ‘evidence of rapid disease progression’ is based on historical eGFR data, the decline in renal function should be due to ADPKD and not related to other diseases, medications or factors that may contribute (reversibly or irreversibly) to a decline in renal function (e.g., diabetes mellitus, NSAIDs, calcineurin inhibitors, dehydration or contrast agents). (iv) The criterion of decline in eGFR ≥5 mL/min/1.73 m2 in 1 year is adopted from the KDIGO CKD Guideline. (v) The criterion of decline in eGFR ≥2.5 mL/min/1.73 m2 per year over a period of 5 years is comparable to class 1C patients in the Mayo classification of ADPKD. (vi) In young ADPKD patients with CKD stage 1, the observation of ‘no change in eGFR’ in general is not considered a sensitive marker of slow disease progression, as eGFR often remains fairly stable during a prolonged period of time, whereas TKV increases steadily, suggesting disease progression. In such patients, changes in TKV and/or prediction models should be applied to assess historical or predicted disease progression. (vii) The criterion of increase in TKV ≥5% per year is likely to be conservative. It is based on the threshold defining the Mayo class 1D patients. This criterion has also been advocated by the Japanese regulatory authorities. The average rate of TKV growth in placebo-treated patients in the TEMPO 3:4 trial was 5.5% per year. (viii) The ellipsoid equation estimates TKV reliably when compared with classical volumetry. (ix) The Mayo classification of ADPKD is based on htTKV indexed for age. It predicts that patients with class 1C, 1D and 1E have more rapid disease progression. A kidney length ≥16.5 cm, as assessed by ultrasound (or MRI), can be used in patients <45 years to indicate a high likelihood of rapid disease progression. (x) The PROPKD score suggests that patients with a truncating PKD1 mutation and early onset of clinical signs (i.e., hypertension, macroscopic haematuria, cyst infection or flank pain before the age of 35 years) have rapid disease progression with start of renal replacement therapy at a relatively young age. (xi) Although there is significant variability in the age of reaching ESRD within families that share the same mutation, clinical experience as well as observational studies have shown that a detailed family history can provide important information for risk prediction. (Reproduced from Figure 3 of Gansevoort et al. [24].)

