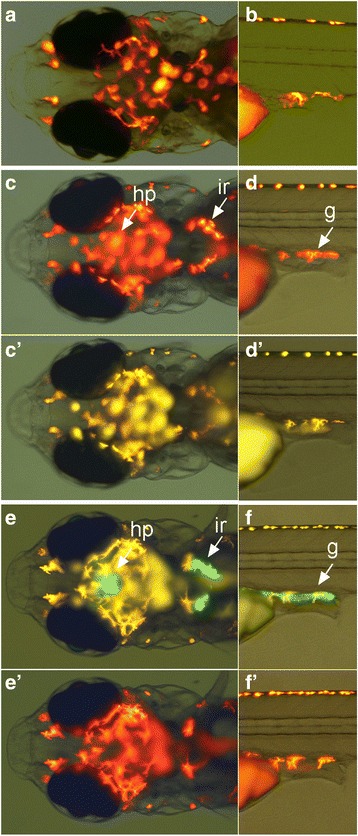
Fig. 3.

Generation of Tg[nr5a1-hs:lRl-GFP] and Tg[nr5a1-hs:GFP] transgenic fish. (a, b) Dorsal view of the head region (a) and lateral view of the trunk region (b) of a control larva at 9dpf with an RFP filter set. Red signals are from the auto-fluorescence of pigment cells. (c, d) Tg[nr5a1-hs:lRl-GFP] transgenic fish viewed with an RFP filter set. RFP is expressed in cells in the hypothalamus (hp), interrenal gland (ir), and gonad (g). Note that the red signals are not auto-fluorescence, as the corresponding signals are absent in a control larva (a and b). (c', d') Tg[nr5a1-hs:lRl-GFP] transgenic fish viewed with a GFP filter set. No GFP expression is present. (e, f) Tg[nr5a1-hs:GFP] transgenic fish with a GFP filter set. GFP is expressed in cells in the hypothalamus (hp), interrenal gland (ir), and gonad (g). Yellow signals are from the auto-fluorescence of pigment cells. (e', f') Tg[nr5a1-hs:GFP] transgenic fish viewed with an RFP filter set. No RFP expression is present
