
Figure 3.
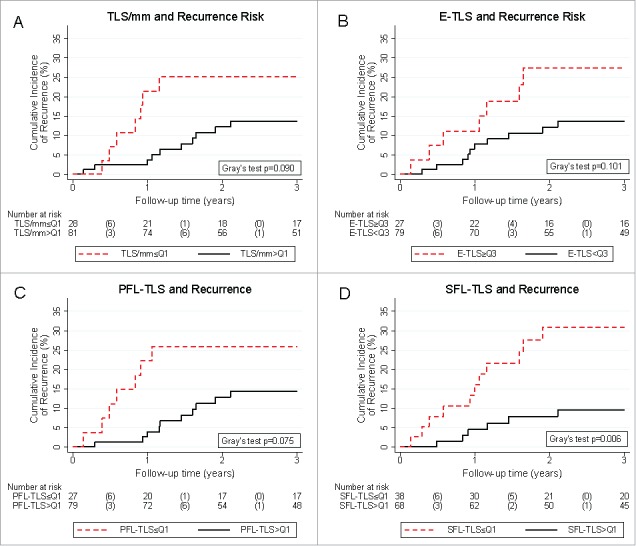
Tertiary lymphoid structure parameters and 3-year risk of colorectal cancer recurrence. Patients with low TLS counts (A), high proportions of E-TLS (B), and low proportions of PFL-TLS (C) showed a tendency towards numerically higher risks of recurrence. Patients with low SFL-TLS proportion (D) experienced a significantly higher risk of recurrence. Absolute risk estimates corresponding to these curves are reported in Table 2. Recurrence risks were estimated with competing risk analysis, treating death-from-any-cause as the competing event of interest. In the risk table, numbers in brackets represent the number of recurrences in the respective time interval. Abbreviations: Q1 – Cut-off at the 25th percentile of the variables' distribution (i.e. quartile 1), Q3 – Cut-off at the 75th percentile of the variable's distribution (i.e. quartile 3).