. 2018 Jan 25;15:E12. doi: 10.5888/pcd15.160611

Figure 1.

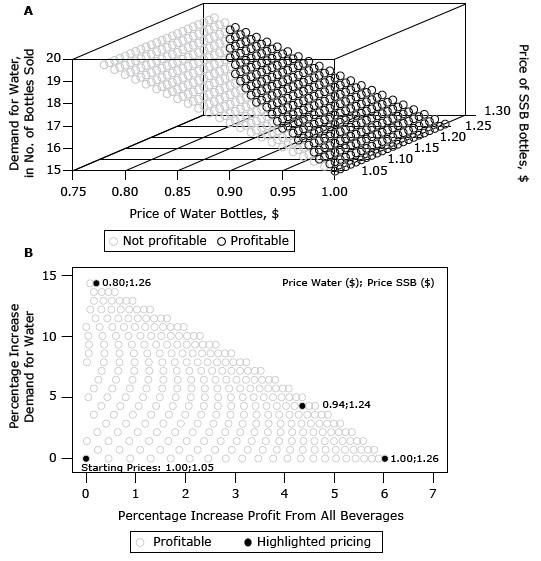
Panel A shows how demand for water increases with decreasing water prices. The range of pricing options are from $0.75 to $1.00 for water and $1.00 to $1.30 for bottles of SSBs. Only a subset of price combinations of SSBs and water are profitable: those in which the price for water ranged from $0.80 to $1.00 and the price for SSBs ranged from $1.00 to $1.26. Panel B shows the percentage increase of demand for water and percentage increase in profit from all beverage sales for profitable pricing combinations only, starting with $1.00 for water and $1.05 for SSBs. Three different prices are highlighted. The first is the price combination for the biggest percentage increase of demand for water: $0.80 for water and $1.26 for SSBs, with an approximately 14% increase in demand for water and no change in profit. The second is the biggest percentage increase of profit: $1.00 for water and $1.26 for SSBs, with an approximately 6% increase in profit but no increase in demand for water. The third is equal increase of both demand and profit: $0.94 for water and $1.24 for SSBs, with an approximately 4% increase in profit and 4% increase in demand for water.

Water demand and profit for coordinated price changes for selling bottles of sugar-sweetened beverages (SSBs) for corner store A, Baltimore, Maryland, 2014. Panel A shows absolute demand of water over prices of water and bottles of SSBs. Panel B shows only profitable price combinations for percentage change of water demand in relation to profit change.