
Figure 2.
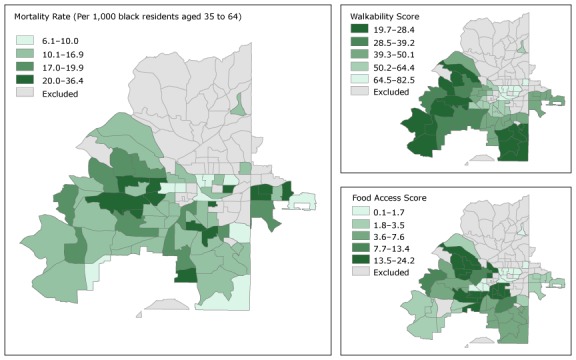
Premature cardiovascular disease (CVD) mortality rate, walkability score, and food access score among black residents, Atlanta, Georgia, 2010–2014. Walkability score is on a scale of 0 to 100, and a higher walkability score indicates worse walkability. Food access scores range from 0 to 100, and a low score indicates better food access. Premature CVD mortality rates are presented in quintiles; these mortality rate categories are common to both Figure 1 and Figure 2 so the maps can be directly compared. Food access scores and walkability scores are presented in quintiles; these categories are also common to both Figure 1 and Figure 2 so the maps can be directly compared.