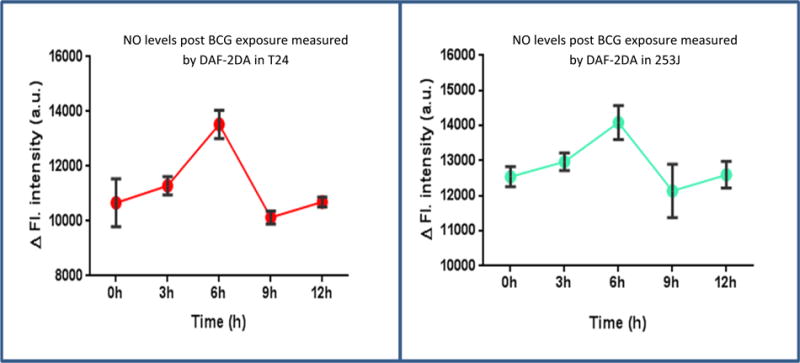
Figure 3.

Effect of BCG on real time global profiling of RNS: T24 and 253J cell lines were exposed to BCG and NO levels were measured using DAF-2DA at different time points post BCG exposure. NO levels starts peaking up at 3h and reach to significantly higher levels at 6h in both T24 (p < 0.01) and 253J (p < 0.01) cell lines compared to control. No significant difference in NO levels between control and treated group were observed 6h onwards (T24, P = 0.57; 253J, p = 0.28). Values on Y axis show the difference between “time correct” control and BCG treated cells.
