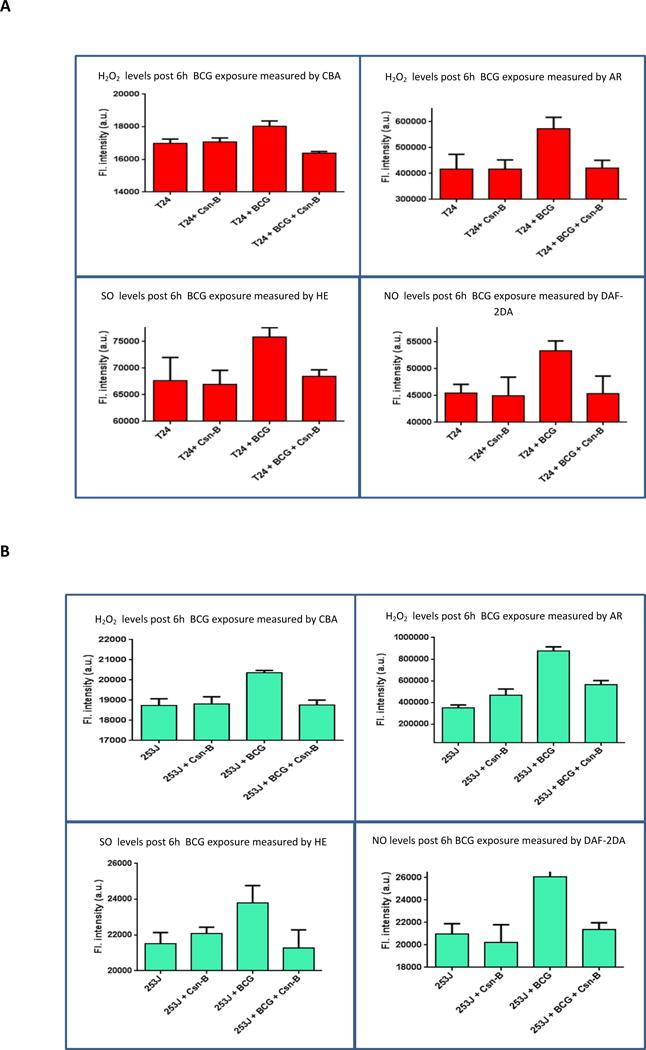
Figure 4.

Effect of BCG internalization on real time ROS/RNS profiling: T24 and 253J cells were exposed to BCG for 6h. Post BCG exposure, H2O2 levels were measured using CBA and AR, O2− levels were measured using HE and NO levels were measured using DAF-2DA. Treatment groups included Untreated, Cytochalasin-B treated, BCG treated and BCG with cytochalasin-B. H2O2, O2− and NO levels significantly decreased in the BCG with cytochalasin-b treatment group in both cell lines, relative to BCG alone. (p < 0.05 for H2O2, p < 0.01 for O2− and p < 0.05 for NO). The difference in Cytochalasin-b control group and cytochalasin-b plus BCG group was statistically non-significant (p = 0.4).
