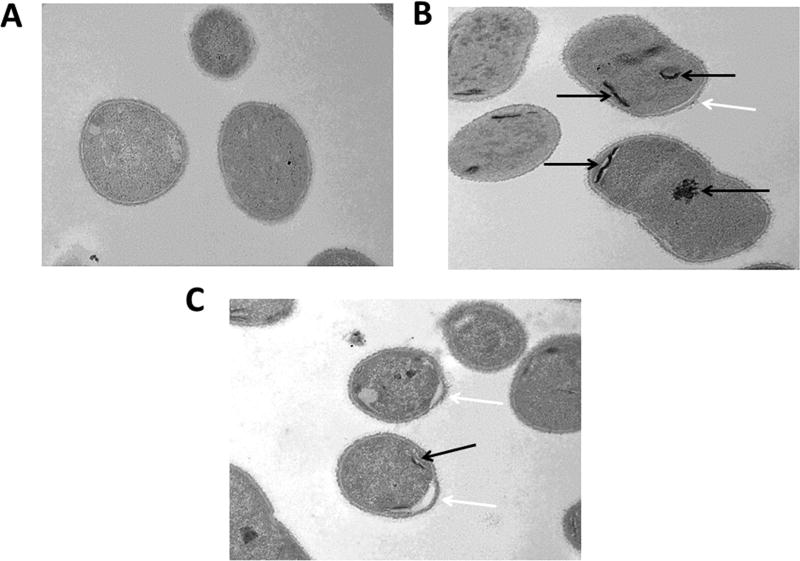
Figure 3.
Thin-section transmission electron microscopy images (20,000×) of AB5075 untreated (A), exposed to ECC145 at 8.0 µg/mL (B), or exposed to ECC188 at 8.0 µg/mL (C) for 1 h. Aggregates are visible in the cytoplasm (black arrows), and membrane disruption (white arrows) is visible on the bacterial surface, distended from the cytoplasm, of the treated bacteria.

