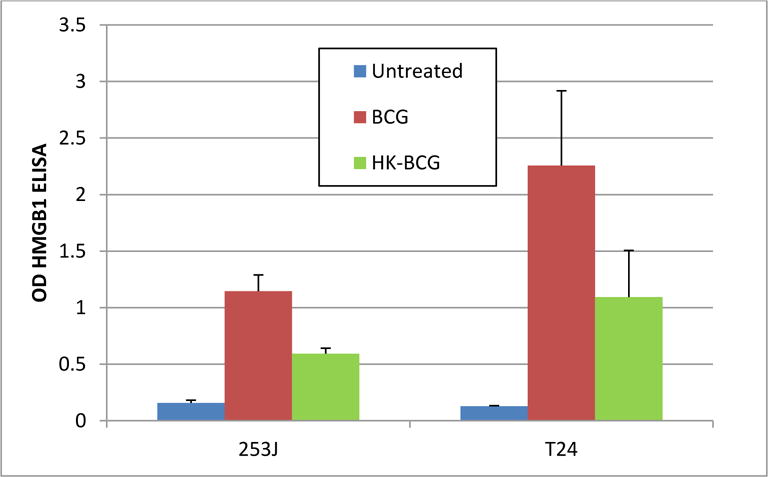
Figure 6. Effect of BCG Viability on HMGB1 release by UC Cell.

Relative to controls, the magnitude of HMGB1 release was increased 7- and 17-fold in 253J and T24 cells, respectively (p < 0.0001). In response to hkBCG the increase relative to controls was 4- and 8-fold, respectively (p < 0.0001). There was statistically significant difference in HMGB1 release between viable and hkBCG (p ˂0.001).
