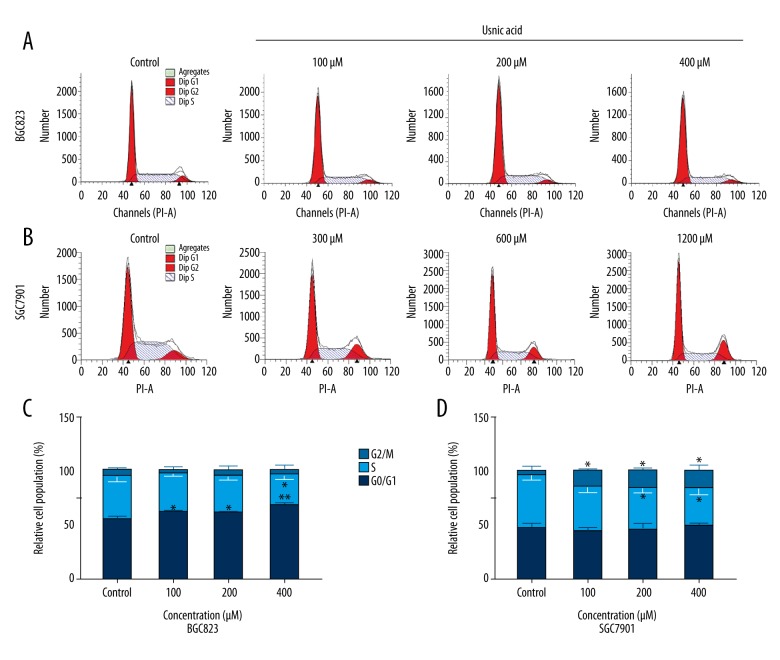
Figure 2.
Effect of UA on cell cycle distribution in BGC823 (A, C) and SGC7901 (B, D) cells. (A, B) Cell cycle detection of BGC823 cells (A) and SGC7901 (B) cells following treatment with a graded concentration of UA for 24 h by flow cytometry. (C, D) Quantification of G0/G1, S, and G2/M phase cells in UA-treated BGC823 and SGC7901 cells at the indicated concentrations. The data represent the mean ±SD from 3 independent experiments. * P<0.05; ** P<0.01(compared with control).

