Figure 8.
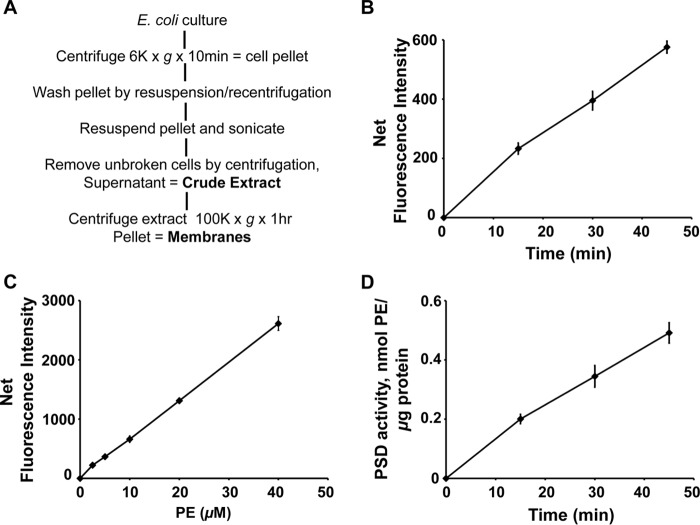
Application of DSB-3–based fluorescence PSD assay to cell extracts containing constitutive levels of bacterial PSD. E. coli (Rosetta DE3 strain) was grown to mid-log phase, and the cells were harvested and processed as shown in A to produce crude extracts. Enzyme assays were performed with crude cell-free extracts (200 ng of protein/μl), 0.5 mm PS, and 3.1 mm Triton X-100 at 37 °C for 0–45 min. The enzyme reaction was arrested, and the DSB-3 conjugation was initiated by 12.5-fold dilution of the enzyme reaction mixture in a buffer that contained 10 mm sodium tetraborate (pH 9.0) and 10 μm DSB-3. After 120 min, the fluorescence was quantified. B, net fluorescence intensities of each PSD assay at the indicated time are shown after background correction. Background fluorescence is the value obtained from the PSD assay at zero time with heat-inactivated cell extracts. C, standard curve of DSB-3 fluorescence with PS/PE mixed micelles produced in the presence of heat-inactivated E. coli cell-free extracts. Mock PSD assays of heat-inactivated cell extracts were performed with the mixed PE/PS micelles, varying the lipid ratios from 0 to 100%, where the total phospholipid content of the micelles was maintained at 0.5 mm. DSB-3 conjugation was performed after dilution of the mixture 12.5-fold. Net fluorescence intensities of increasing PE content in the mixed PE/PS micelles are calculated after background correction with the fluorescence value of the 0 mm PE, 0.5 mm PS. D, PSD activity of the E. coli cell-free extracts was calculated by applying the fluorescence data in B and C. The data are from five independent experiments and are means ± S.E. (error bars).

