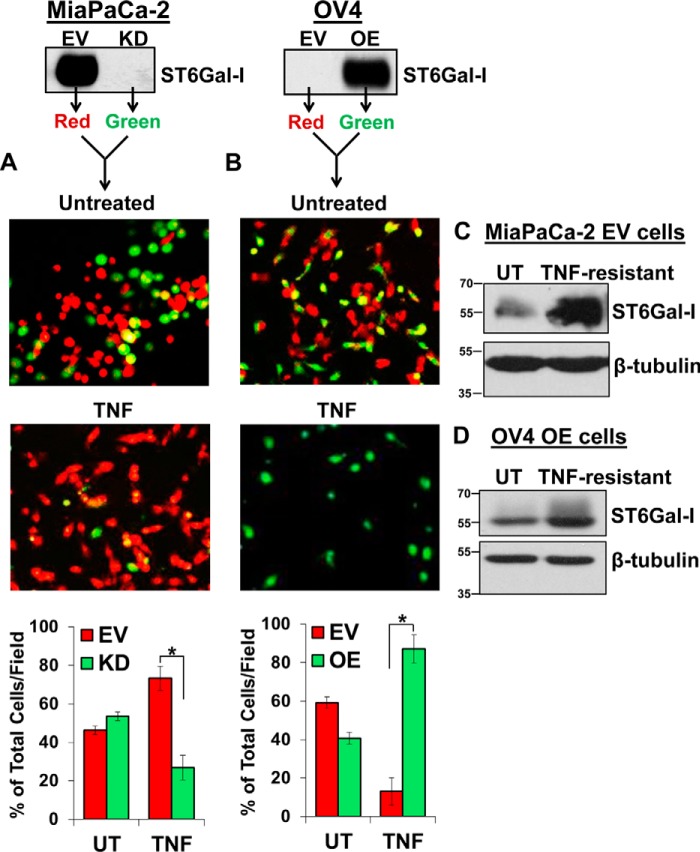
Figure 3.
ST6Gal-I levels are enriched in TNF-treated cells. A, MiaPaCa-2 EV and KD cells were prelabeled with their own distinct CellTracker fluorescence dye (EV, red; KD, green), seeded at equal densities into tissue culture wells, and then treated with TNF. After 24 h, a fluorescence microscope was used to image the cells. Four distinct fields of the representative experiment were quantified via ImageJ and plotted as the percentage mean of total cell population per field ± S.D. *, p < 0.05. B, OV4 EV and OE cells were prelabeled with distinct fluorescence dyes (EV, red; OE, green), seeded at equal densities, and then treated with TNF plus CHX. After 24 h, cells were imaged, and the number of red versus green cells was enumerated. Four distinct fields of the representative experiment were quantified via ImageJ and plotted as the percentage mean of total cell population per field ± S.D. *, p < 0.05. C, MiaPaCa-2 EV cells were treated with TNF, and after 24 h, lysates were prepared from the cells still adhered to the plate and immunoblotted for ST6Gal-I. D, OV4 OE cells were treated with TNF plus CHX, and after 24 h, lysates derived from the remaining cells were immunoblotted for ST6Gal-I. The immunoblots in A and B are duplicates of the blots in Fig. 1, A and D, respectively. These images were duplicated to clarify the experimental design. UT, untreated.

