Figure 3.
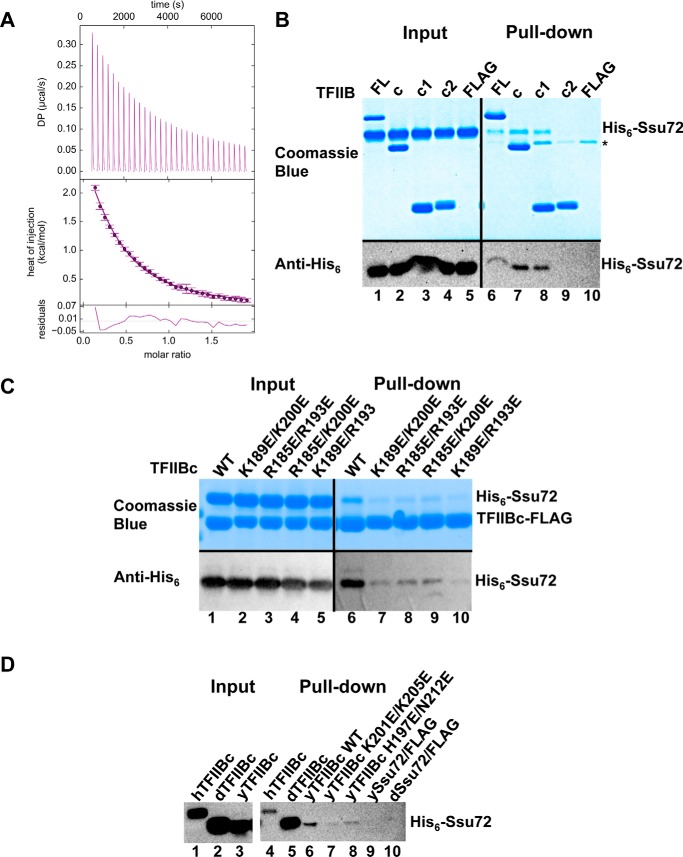
Physical interaction of TFIIBc and Ssu72. A, ITC experiment of Ssu72 and TFIIBc. The best fit Kd value (95% confidence interval) is 20.2 (16.8–24.4) μm. B, FLAG pulldown assay with TFIIB-FLAG variants and His6-Ssu72, as visualized by Coomassie staining and Western blotting with a His6 antibody. *, IgG light chain that leeched from the resin upon elution with glycine. C, FLAG pulldown assay with TFIIBc-FLAG mutants and His6-Ssu72. D, FLAG pulldown assay with TFIIBc-FLAG WT and mutants from various species (top labels) with His6-Ssu72 from the corresponding species as visualized by Western blotting with a His6 antibody. In the figure, h represents human, d is D. melanogaster, and y is S. cerevisiae. Lanes labeled with FLAG indicate controls without TFIIBc added.

