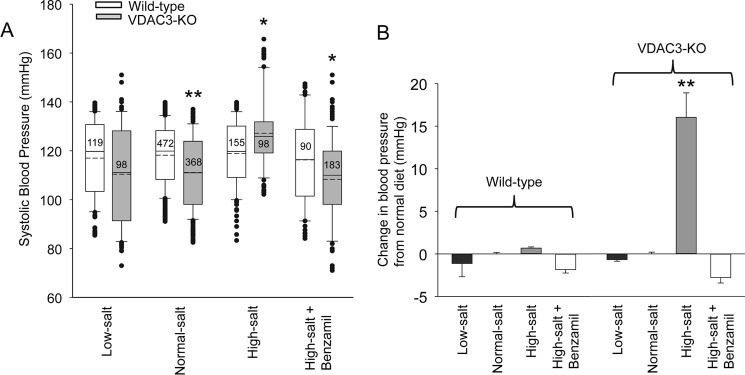
Figure 2.
VDAC3-KO mice have an abnormal blood pressure response to changes in salt in their diet. We measured the blood pressure of wildtype and knockout animals fed low-salt, normal-salt, high-salt, or high-salt plus benzamil diets. A, systolic blood pressure of wildtype and VDAC3-KO mice on diets after 2 weeks. The boundary of the box plots closest to zero indicates the 25th percentile, a solid line within the box marks the median and the dashed line is the mean, and the boundary of the box farthest from zero indicates the 75th percentile. Whiskers (error bars) above and below the box indicate the 90th and 10th percentiles. Outlying points are represented by filled circles. Numbers within boxes are total number of measurements for each condition. B, the difference between wildtype and knock-out blood pressure can best be appreciated by examining the change in blood pressure compared with normal diet. **, p < 0.001; *, p < 0.05, Kruskal-Wallis ANOVA on ranks with Dunn's post test.

