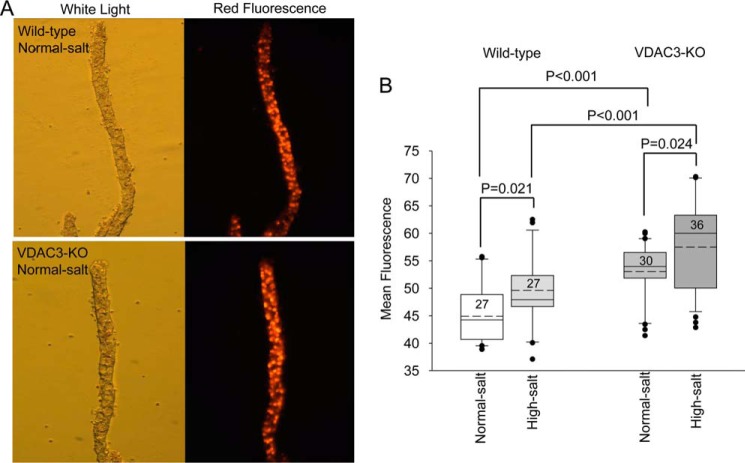
Figure 5.
ROS levels are elevated in VDAC3-KO CCD. Wildtype and VDAC3-KO mice were fed normal and high-salt diets for 2 weeks. A, representative tubules from wildtype and VDAC3-KO mice on a normal diet in white light and red fluorescence forms. B, mean fluorescence in wildtype and VDAC3-KO animals on normal and high-salt diets. Box plot with whiskers as explained in Fig. 2A. p values were marked as above, one-way ANOVA with Holm-Sidak post test.

