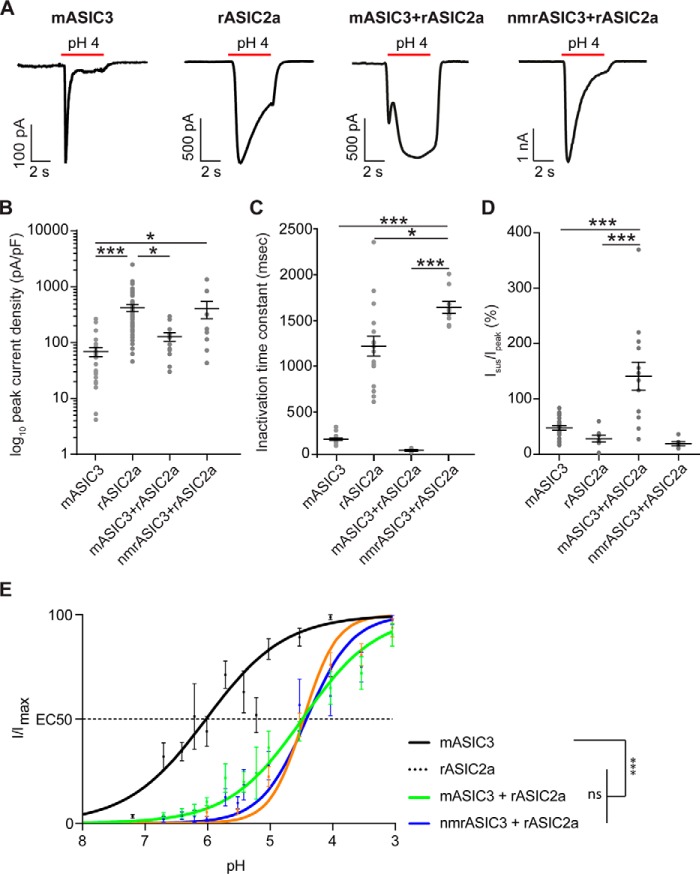
Figure 4.
Characterization of CHO cells co-expressing rASIC2a and mASIC3 or nmrASIC3. A, currents recorded from CHO cells expressing mASIC3, rASIC2a, mASIC3 + rASIC2a, or nmrASIC3 + rASIC2a. B–D, quantification of log10 peak current density (B), inactivation time constant (C), and sustained current in proportion to peak current (D). Bars represent mean ± S.E. E, pH-response curves of mASIC3, rASIC2a, mASIC3 + rASIC2a, and nmrASIC3 + rASIC2a. Data were analyzed by ANOVA with Tukey's multiple comparison test. ***, p < 0.001 comparing all conditions.

