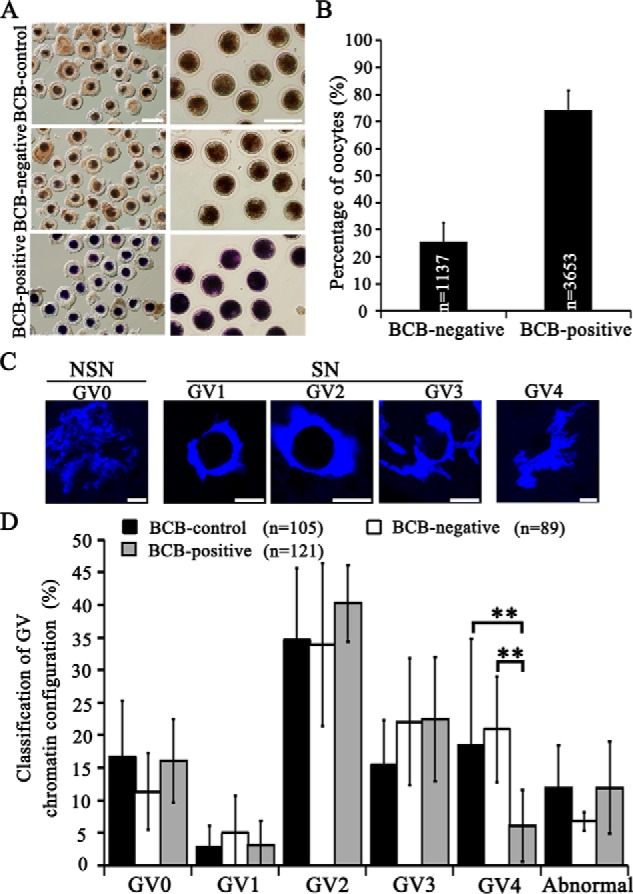
Figure 1.

BCB staining to categorize porcine immature GV oocytes and classification of chromatin configuration. A, representative images of porcine COCs after BCB staining (left panel) and oocytes denuded off cumulus cells (right panel). Scale bar, 200 μm. B, the number and percentage of BCB-negative and BCB-positive COCs. C, representative images of chromatin configuration of GV oocyte nuclei. Scale bar, 10 μm. D, percentages of GV oocytes classified into different types of chromatin configuration from BCB-control, BCB-negative, and BCB-positive groups. **, p < 0.01.
