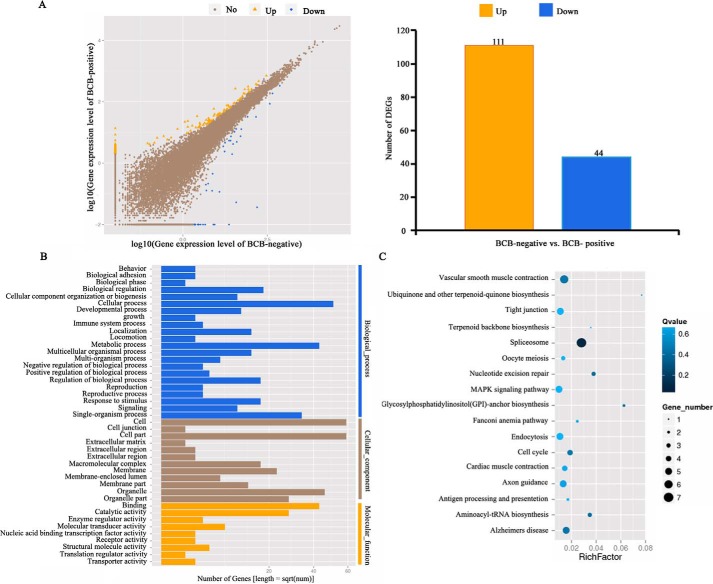
Figure 3.
Single-oocyte transcriptome sequencing. A, gene expression analysis to identify up- and down-regulated genes in BCB-positive oocytes as compared with BCB-negative oocytes. B, gene enrichment analysis on differentially expressed genes. C, KEGG pathways enriched from differentially expressed genes.

