Figure 2.
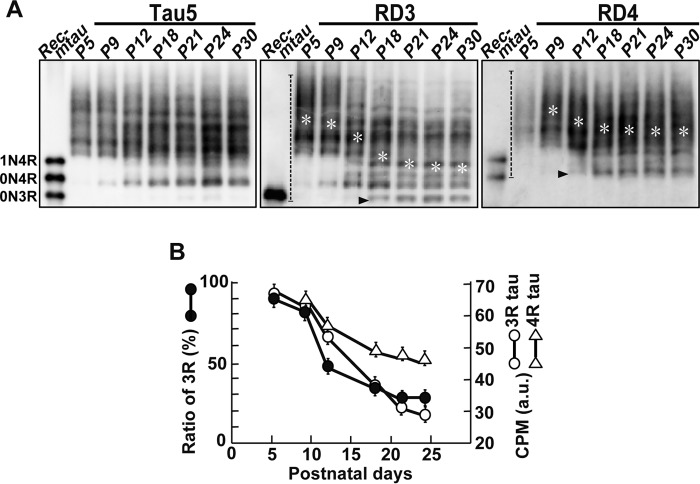
Phosphorylation profiles of 3R and 4R tau in developing mouse brains. A, immunoblots of tau in postnatal mouse brains from P5 to P30 with Tau5 (left), RD3 (middle), and RD4 (right) after Phos-tag SDS-PAGE. The center of phosphorylation mass was measured by densitometric scanning of the region indicated by dotted lines in the blots of RD3 and RD4, and is indicated by white asterisks. Rec-mtau is recombinant mouse tau. Black arrowheads indicate non-phosphorylated 0N3R tau in RD3 and 0N4R tau in RD4. B, comparisons of the decrease in the 3R or 4R tau isoform and phosphorylation during postnatal development. For the 3R tau isoform, the data from Fig. 1B is used (black circles, y axis on the left side). For phosphorylation levels, the center of phosphorylation mass (CPM) in the blot of RD3 (middle in A) and RD4 (right in A) is used (white circles for RD3 and white triangles for RD4, y axis on the right side). The data are presented as the mean (n = 3). Error bars represent S.E. a.u., arbitrary units.

