
Figure 8.
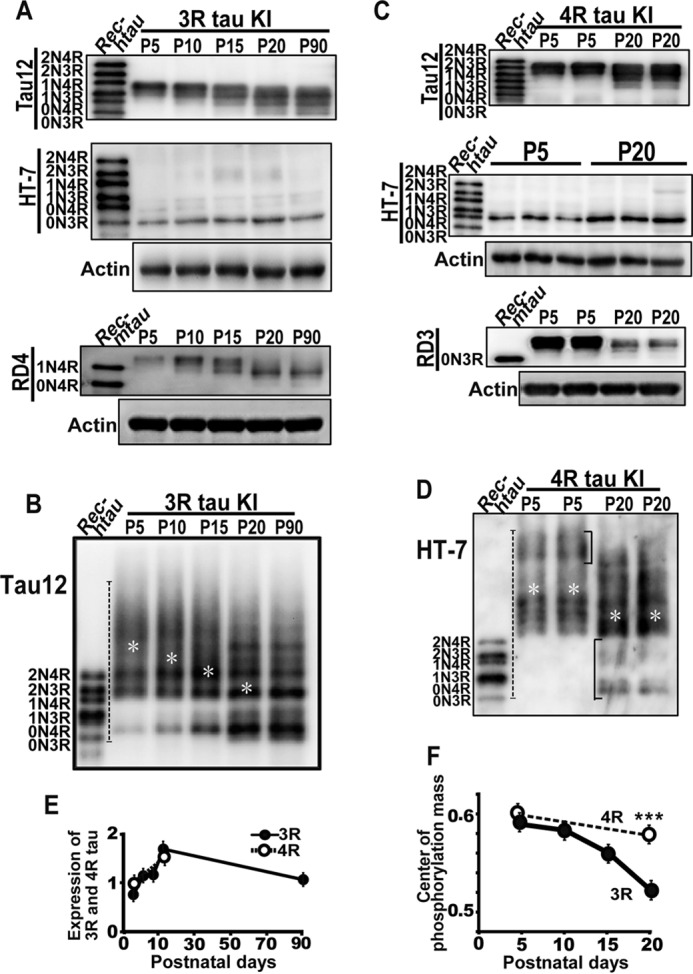
Phosphorylation of knockin human 3R or 4R tau in mouse brains. A, an immunoblot of knockin (KI) human 0N3R tau in mouse brains (+/h3rtau) from P5 to P90 with anti-human tau Tau12 (upper) and an immunoblot with anti-human tau HT7 after dephosphorylation (middle). RD4 shows endogenous mouse 4R tau in the same mice. Rec-htau is recombinant human six tau isoforms in the blots of Tau12 and HT7, and Rec-mtau is recombinant mouse tau in the blot of RD4. Actin is the loading control. B, phosphorylation states of human 3R tau assessed by immunoblotting with Tau12 after Phos-tag SDS-PAGE. The left lane is recombinant human six tau isoforms (Rec-htau). White asterisks indicate the position of the center of phosphorylation mass. C, an immunoblot of knockin human 0N4R tau in the mouse (+/h4rtau) brain in duplicate at P5 and P20 with anti-human tau Tau12 (upper) and an immunoblot with anti-human tau HT7 after dephosphorylation (middle). RD3 shows endogenous mouse 3R tau in the same mice. Actin is the loading control. D, phosphorylation of human 0N4R tau was assessed by immunoblotting with anti-human-specific tau HT7 after Phos-tag SDS-PAGE. Rec-htau is recombinant human tau isoforms. White asterisks indicate the position of the center of phosphorylation mass. E, expression levels of knockin human 3R (black circles) or 4R tau (white circles) in mouse brains quantified after dephosphorylation. The data are presented as the mean (n = 3). Error bars represent S.E. F, the center of phosphorylation mass of 3R and 4R tau during brain development. Black circles are 3R, and white circles are 4R tau. The data are presented as the mean (n = 3; ***, p < 0.001). Error bars represent S.E.