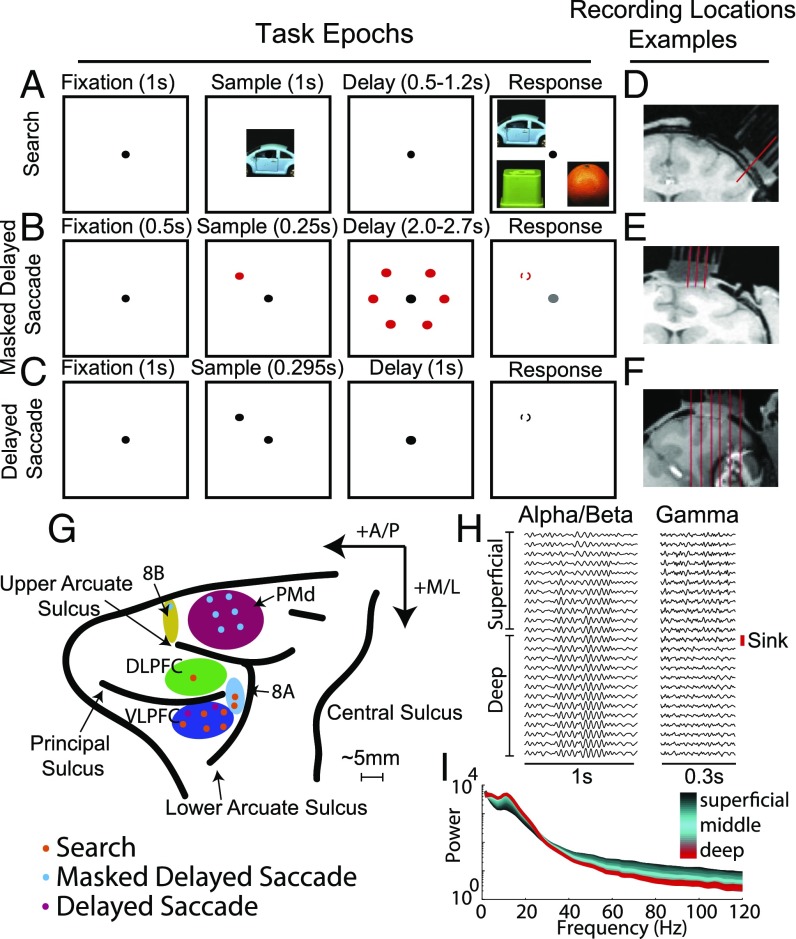
Fig. 1.
(A) Visual search task. A match between sample and test image was chosen after a delay (0.5–1.2 s) by making a saccade to the match. Each image was positioned randomly at any one of four possible locations (Upper Right, Lower Right, Upper Left, and Lower Left). (B) Masked delayed saccade. After a sample period, during which a single spatial location was cued (one of six possible locations), the animal had to hold fixation through a variable delay (2.2–2.7 s) and the presentation of the visual mask. After this delay, and when the fixation point color changed, the animal had to saccade to the previously cued location. (C) Delayed saccade. After a sample period, during which a single spatial location was cued (one of four possible locations), the animal had to hold fixation through a fixed delay (0.99 s) and saccade to the cued location when the fixation dot disappeared. (D and E) The small red lines indicate sample trajectories chosen to be as perpendicular as possible to cortex. (F) The small red lines indicate sample trajectories that were possible given the recording hardware. Only the third trajectory from the left was used for laminar recordings. (G) We recorded across frontal cortex. The different colored dots indicate the task, and the letters indicate the corresponding anatomic region. In addition to those labeled, we recorded from the anterior cingulate cortex (ACC) and the supplementary motor area (SMA) (SI Appendix, Fig. S12). (H) Sample LFP recordings were bandpass-filtered at 10–25 Hz (Left) and 40–160 Hz (Right). The red line marks the location of the first significant CSD sink and the border between the superficial and deep layers. (I) A sample power spectrum with a clear alpha/beta bump (between 10 and 25 Hz) and broadband gamma (>40 Hz). The variations across layers are plotted as a color gradient (black, superficial to red, deep).

