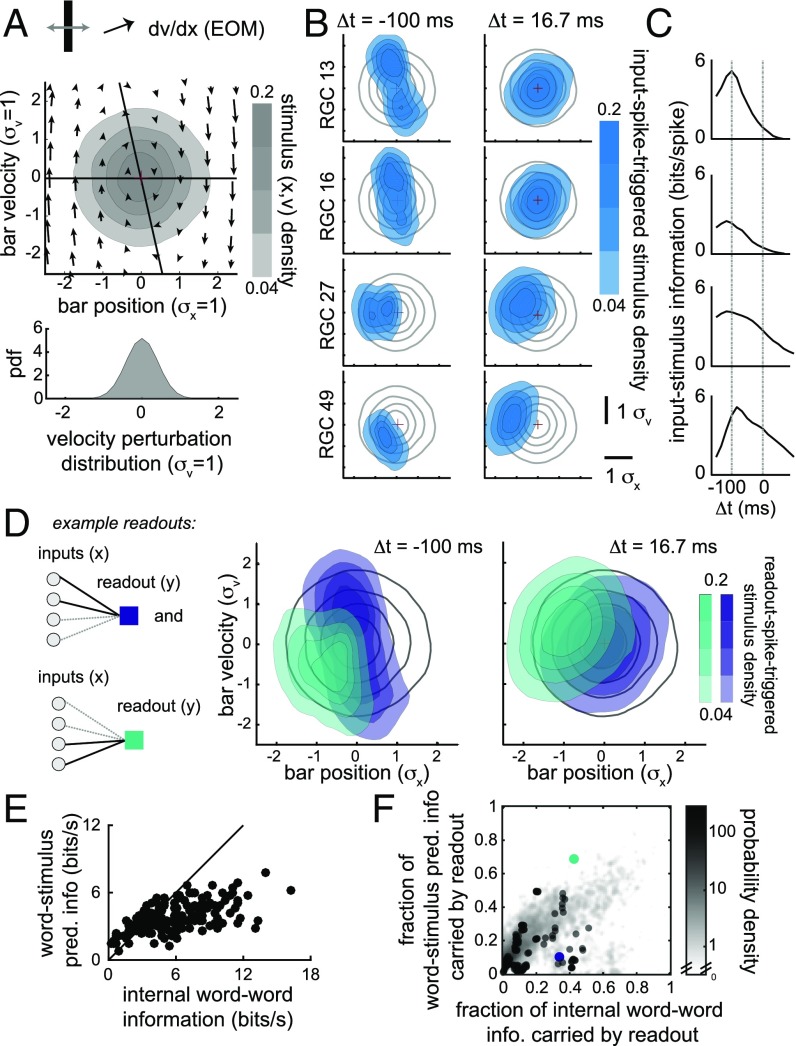
Fig. 1.
Spikes in sets of RGCs are informative of both past and future position and velocity of a moving-bar stimulus. (A) A population of RGCs was stimulated using a moving-bar stimulus, with dynamics of the stochastic overdamped harmonic oscillator. (Top) Phase plot of the dynamics with overlaid shading showing the distribution of bar position and velocity over the duration of the recording. (Bottom) Distribution of stochastic “kicks” to velocity. (B) Cross-section of the distribution of position and velocity of the bar stimulus relative to spiking in each of four RGCs, taken at two time points, (Left, past) and (Right, future). Prior distribution of position and velocity is shown as gray contours in background to illustrate how spiking in an RGC constrains expected values of bar position and velocity. (C) Stimulus information quantified for each of the four RGCs in B as a function of perispike time, from 150 ms before the RGC spike to 100 ms after. RGC 27 and 49 have large amounts of stimulus-predictive information (). (D) Two example readouts (Left: solid black lines indicate strong connections and dashed gray lines weak ones). The readout-spike-triggered distribution of position and velocity was computed at perispike time and . Both readouts have high (5.1 and 5.4 bits per s) past information (), but only the green readout has high stimulus-predictive information (4.2 bits per s). (E) Word–word internal predictive information is correlated with word–stimulus predictive information across sets of four cells. (F) The fraction of word–stimulus information carried by a readout is correlated with the fraction of internal word–word information carried by that readout. Grayscale shows density of readouts across the sets in E; superimposed dots show all perceptron readouts for this particular set of four cells. Purple and green dots are the example readouts from D. Error bars for information estimates are smaller than the marker size (<0.2 bits per s in E; <0.02 in F). EOM, equation of motion; info, information; pdf, probability density function; pred, predictive.

