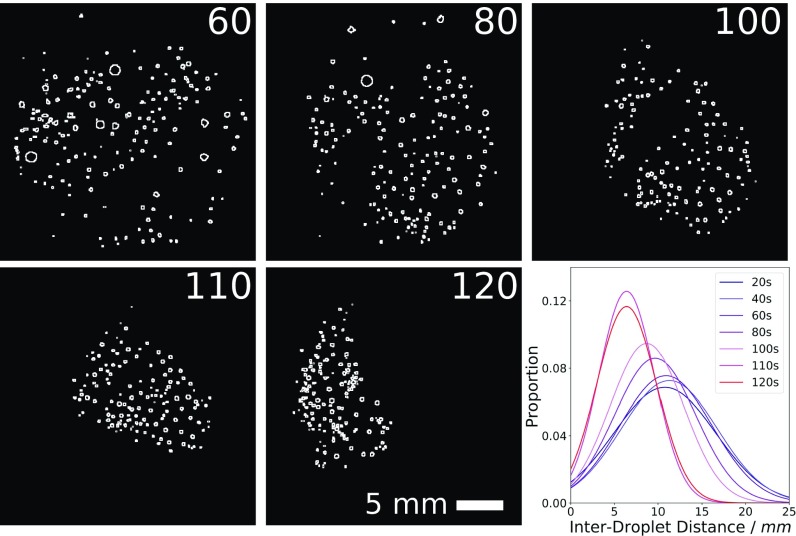
Fig. 6.
Movie snapshots of a swarming formulation, converted into black and white outlines using ImageJ. Numbers in the corners correspond to the experiment time in seconds since the experiment started. Initially there are relatively few droplets, fairly evenly spaced (0–60 s). These then divide and swarm, to give more droplets closer together. At around 100–105 s, the rapid dissolution of a droplet stuck to the edge of the dish (not shown) leads to a much tighter-knit swarm, with an average interdroplet distance of only around 6.4 mm. The variation in interdroplet distance is also seen to decrease. Images processed using ImageJ (29).

