Fig. 1.
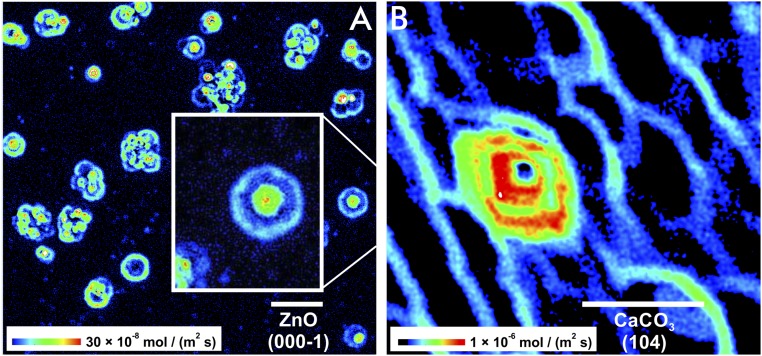
Dissolution rate maps show quantitatively the spatial distribution of the time-normalized material flux. Note the intervals between two reaction fronts. Such surface areas are free of any material flux or show significantly lowered reactivity. The initially isolated rate pulses occur at etch pits that are formed around the outcrops of line defects. The locally regular material release is complicated after spatial superimposition of rate pulses. Rate maps of two dissolving crystal surfaces are shown. (A) ZnO (000-1) with concentric and equidistant rate pulses. (B) CaCO3 (104) with repeated rate pulses (red) at a screw dislocation and single stepwave fronts (blue) originating from point defects. (Scale bar length: 10 µm.)

