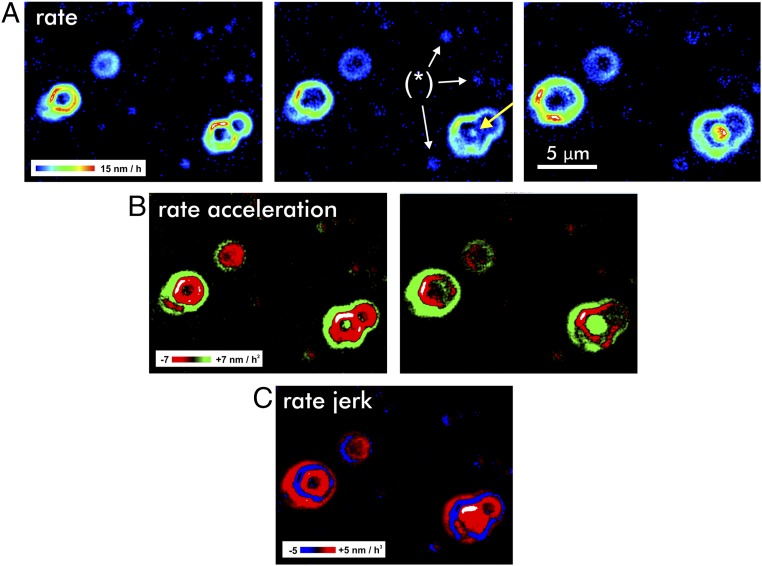
Fig. 2.
Surface reactivity maps illustrate the dynamics of the reacting crystal. The maps are based on difference calculations, that is, the temporal derivative. Three rate maps (Upper) result in two rate acceleration maps (Middle) and, subsequently, in a single map quantifying the change of the rate acceleration, the jerk (Lower). (A) Rate maps of a dissolving (000-1) ZnO face show the pulsed material flux from the surface and the lateral spread of reactive surface area. Note the onset of a new rate pulse (arrow) at a screw dislocation. Dissolution at point defects [examples are indicated by (*)] results in comparatively very low rate contributions (dark-blue color, no higher rate portions) and affect only a minor area of the reacting surface. (B) Rate-acceleration maps indicate regions that are subject of increasing (green) or decreasing (red) surface reactivity. (C) The rate-jerk map visualizes the emerging increase (red) versus decrease (blue) of surface reactivity.

