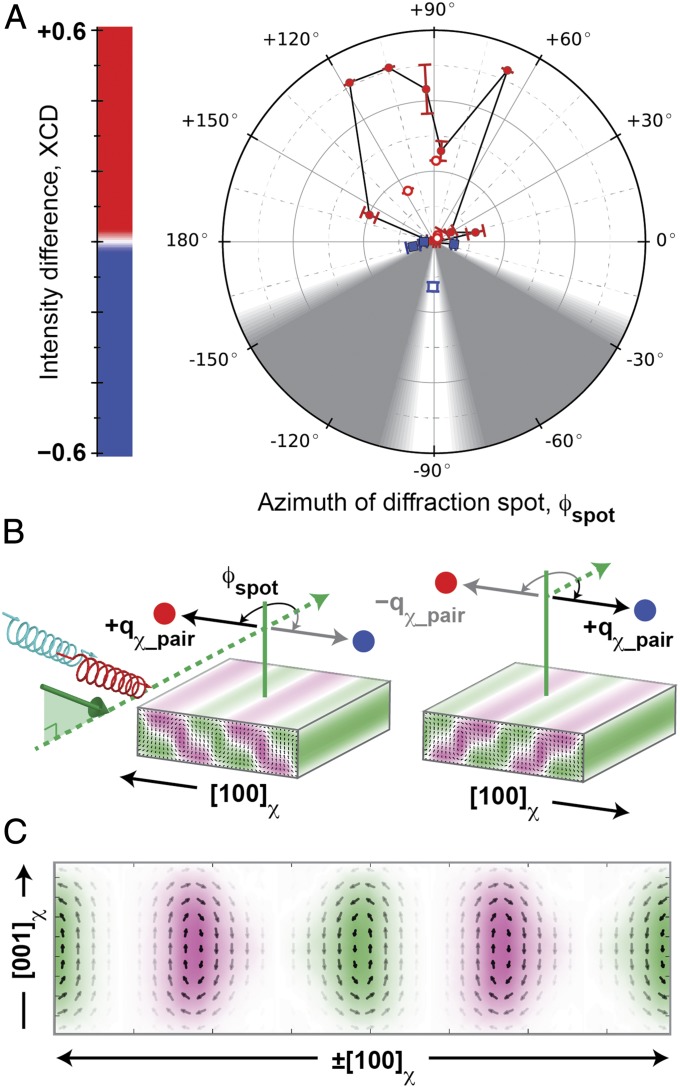
Fig. 3.
Rotational symmetry of chiral polar arrays observed in azimuthal pattern of XCD. (A) XCD intensity plotted versus azimuth, ϕspot, for each diffraction spot from the polar arrays. Red circles indicate XCD > 0; blue squares indicate XCD < 0. Filled markers were measured at nSL = 4; hollow markers were measured at nSL = 3. Gray regions show experimentally inaccessible sample geometries. (B) Diffraction patterns for two sample orientations (separated by 180° azimuthally) exhibit similar XCD (red and blue circles) relative to the scattering geometry: Φ = 0° (Left) and 180° (Right). Curved arrows indicate ϕspot, measured from the in-plane projection (dashed green arrow) of the incoming X-rays. Sample is depicted with counterrotated polarization cores (small black arrows) and alternating axial polarization (green and magenta) domains. (C) Polarization structure is averaged over both orientations in the (010)χ cross-section. These polar cores possess a chiral texture that is robust versus a twofold rotation. Error bars in A represent uncertainty in fitting the XCD spectra at each azimuth (Azimuthal XCD Measurements).

