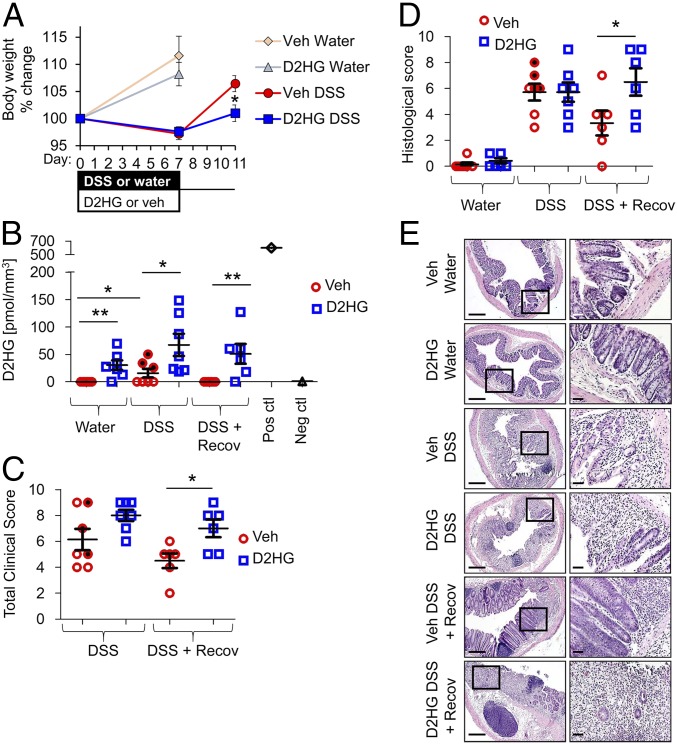
Fig. 1.
D2HG impedes recovery from DSS colitis. (A–D) Percent body weight change (A), colonic D2HG levels measured by enzymatic assay (B), clinical scores (C), and histological score (D) of mice i.p. injected with vehicle (red trace) or 25 mg/kg D2HG (blue trace) daily during DSS-induced colitis. Glioma tissue with IDH1 mutation was used as a positive control, and glioma with wild-type IDH1 was used as a negative control (B). Shaded data points indicate vehicle-treated mice with highest D2HG levels during DSS. Results are presented as means ± SEM of pooled data (A) or individual data points ± SEM of six to seven mice per group (B–D). Before completion of the experiment, one DSS + D2HG-treated mouse and one DSS recovery + D2HG-treated mouse did not survive and are not included in the sample size. *P < 0.05, **P < 0.01 relative to vehicle, by one-way ANOVA followed by Bonferroni’s test. (E, Left) Photomicrographs of histological sections of H&E-stained distal colon. (Scale bars: 200 μm.) (Right) Boxes denote areas shown at higher magnification. (Scale bars: 100 μm.)

