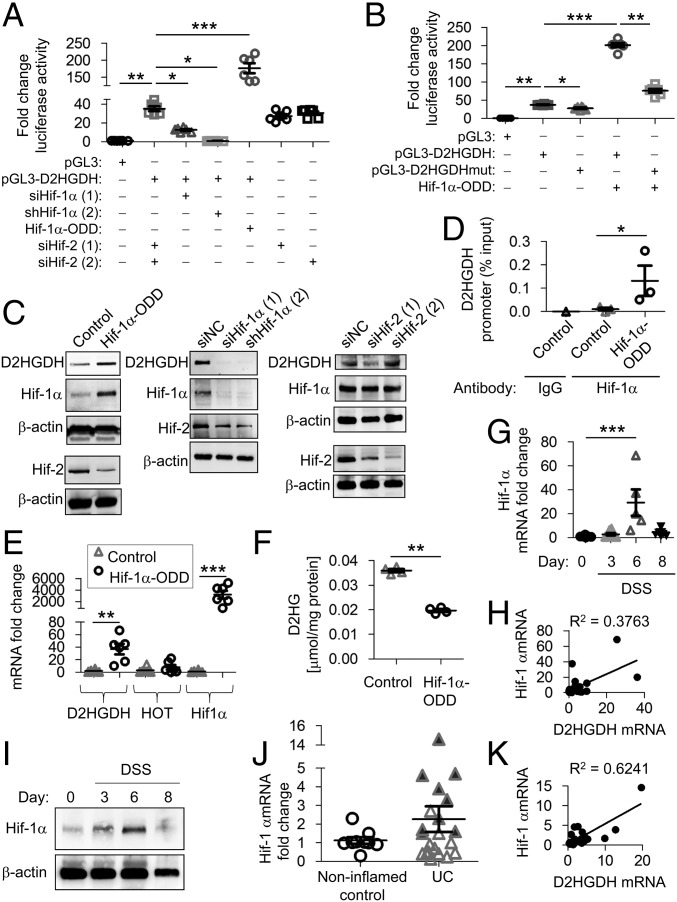
Fig. 4.
Hif-1α modulates D2HGDH expression. (A and B) Caco2-BBE cells were transfected with Hif-1α–ODD–pIRES (Hif-1α-ODD), a constitutively active Hif-1α expression plasmid, empty vector (Control), two independent RNAi constructs against Hif-1α, two independent RNAi constructs against Hif-2α, or RNAi negative control (siNC) for 48 h. D2HGDH promoter activation was measured by luciferase reporter expression (A) and compared with D2HGDH promoter harboring mutation of the putative Hif-1α–binding site (pGL3-D2HGDHmut) (B). (C) Representative Western blots of D2HGDH. Hif-1α and Hif-2 protein expression is shown to demonstrate overexpression or knockdown efficiency. (D) An anti–Hif-1α antibody or IgG negative control antibody was used for ChIP in extracts from Caco2-BBE cells overexpressing Hif-1α–ODD–pIRES or empty vector (control). Immunoprecipitates were analyzed by qPCR using D2HGDH promoter-specific primers targeting the putative Hif-1α–binding site. The relative enrichment of Hif-1α binding is shown as the percentage of total input DNA. (E) mRNA expression by qPCR in Caco2-BBE cells overexpressing Hif-1α–ODD–pIRES or empty vector (control). (F) D2HG levels measured by enzymatic assay. (G) Mouse colonic epithelial Hif-1α mRNA expression measured by qPCR. (H) Regression analysis of mouse colonic epithelial mRNA expression during DSS-induced colitis. (I) Representative Western blots of Hif-1α protein expression in colonic epithelial cells. (J) Colonic Hif-1α mRNA expression measured by qPCR in human mucosal biopsies. Shaded triangles represent patients with a greater-than-threefold increase in DH2GDH mRNA in Fig. 3B. (K) Regression analysis of human colonic mucosal mRNA expression. Results are presented as six Caco2-BBE samples representative of two independent experiments (A, B, and E) or three (C and D) or four (F) Caco2-BBE samples per group. Results are presented as individual data points ± SEM of five to nine mice per time point (G) or nine normal or 21 UC patients (J) or as representative blots of three mice per group (I). *P < 0.05, **P < 0.01, and ***P < 0.005 by one-way ANOVA followed by Bonferroni’s test (A, B, E, and G) or by unpaired, two-tailed Student’s t test (D, F, and J).

