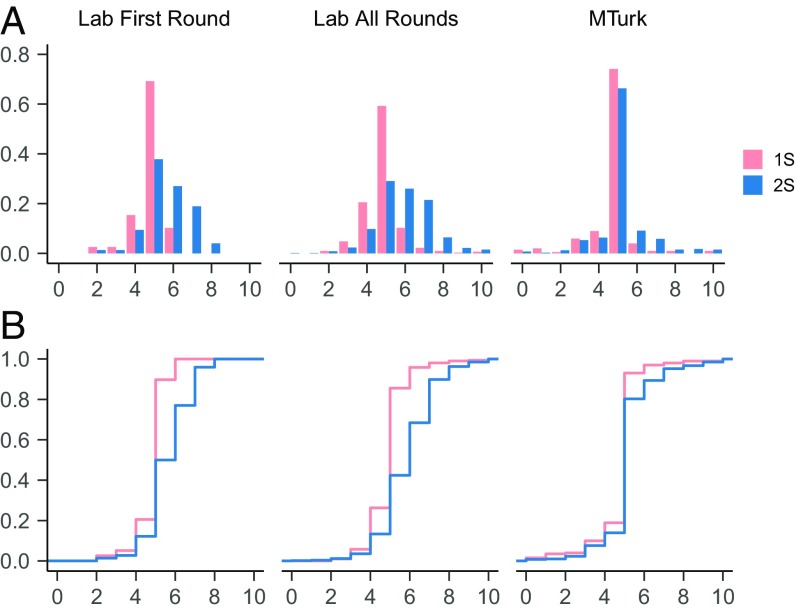
Fig. 1.
Histograms of offers (A) and cumulative distribution functions (B). In all three series the frequency of offer 5 decreases in 2S, relative to 1S, while the frequencies of offers 6 and 7 increase. Writing P values for laboratory first round, laboratory all rounds, and MTurk, in order, the hypothesis of equal proportions of offer 5, against the one-sided alternative of a decline in 2S, is rejected with P = 0.001, P < 0.001, P = 0.032; the hypotheses of equal proportions of offer 6 and of offer 7, against the one-sided alternative of an increase in 2S, are rejected with P = 0.034, P < 0.001, P = 0.002 and P = 0.005, P < 0.001, P = 0.005, respectively [χ2 test of proportions for laboratory first round and MTurk, bootstrapped simulations for laboratory all rounds (SI Appendix)].

