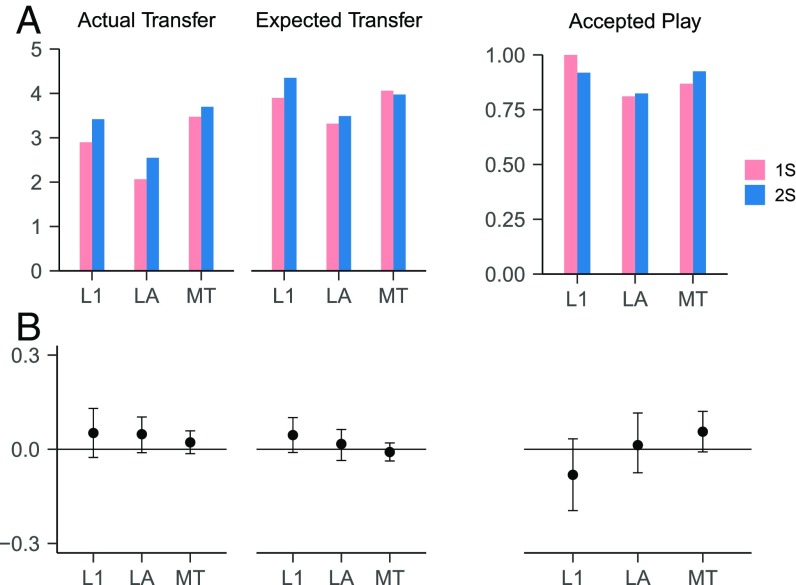
Fig. 3.
Transfers, expected transfers, and frequency of accepted play for 1S and 2S: point values (A) and normalized percentage differences (2S − 1S) with 95% confidence intervals (B). The three data series are identified as L1 (laboratory first round), LA (laboratory all rounds), and MT (MTurk). The normalized difference is expressed as share of the maximal possible difference. In all cases, the 95% confidence interval includes zero. One-sided tests (against the alternative that the relevant variable is higher in 2S) lend marginally higher statistical significance to the differences between the two treatments. Reporting results in order (L1, LA, MT), P = 0.094, P = 0.049, P = 0.114 (for transfers); P = 0.054, P = 0.215, P = 0.720 (for expected transfers); and P = 0.890, P = 0.374, P = 0.046 (for frequency of accepted play) [one-sided t test of means and χ2 test of proportions for L1 and MT, bootstrapped simulations for LA (SI Appendix)].

