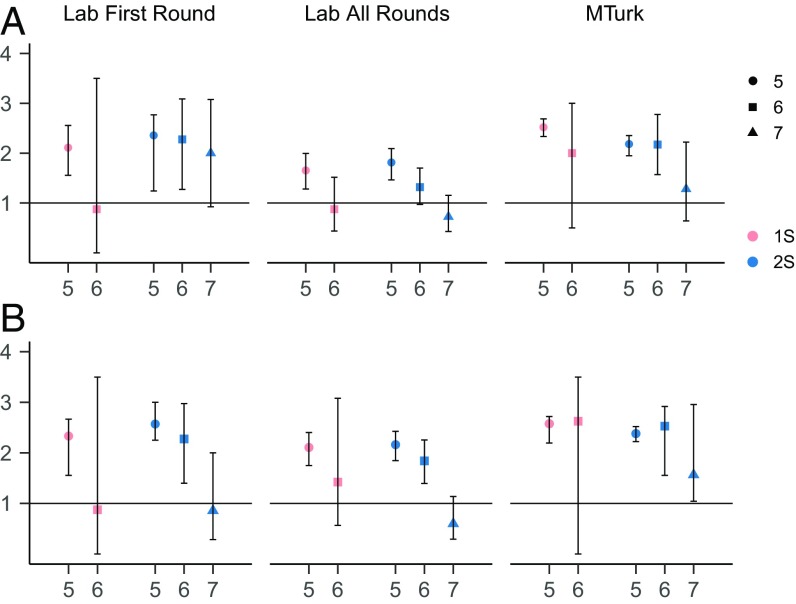
Fig. 6.
Receivers’ (A) and senders’ (B) beliefs at x or (x − 1), following offer x. Each point is normalized by the expected mass of reported beliefs at x or (x − 1) if any belief between 0 and x is equally likely. An offer is persuasive if the ratio is higher than 1. For receivers' beliefs (A), in 1S the ratio is significantly higher than 1 only for offer 5 (P < 0.001 for all three data series); in 2S the ratio is significantly higher than 1 for offer 5 (P < 0.001 for all data series) and for offer 6 (P = 0.001 for laboratory first round, P = 0.040 for laboratory all rounds, and P < 0.001 for MTurk), and for no other offer. For senders' beliefs (B), in 1S the ratio is significantly higher than 1 only for offer 5 (P < 0.001 for all data series) and for offer 6 in the MTurk data only (P = 0.004); in 2S the ratio is significantly higher than 1 for both offer 5 and offer 6 (P < 0.001 in both cases for all data series), and for no other offer. In B, MTurk data, offers 6 and 7, apparent contradictions between the confidence intervals and the bootstrapping P values are due to the scarcity of data and sparsity of the distributions. See SI Appendix for details on the test.

